
Page 216 - Integrated Wireless Propagation Models
P. 216
194 C h a p t e r F o u r
Buildings
en
-o
t: 20
=
00:
-J
1 0
Range d 1 (in feet)
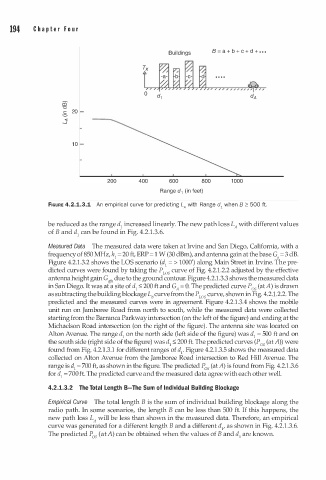
FIGURE 4.2.1.3.1 An empirical curve for predicting LA with Range d1 when B � 500 ft.
be reduced as the range d1 increased linearly. The new path loss L with different values
A
of B and d1 can be found in Fig. 4.2.1.3.6.
Measured Data The measured data were taken at Irvine and San Diego, California, with a
=
frequency of 850 MHz, h1 2 0 ft, ERP = 1 W (30 dBm), and antenna gain at the base G a = 3 dB.
'
Figure 4.2. . 3.2 shows the LOS scenario (d1 = > 1000 ) along Main Street in Irvine. The pre
1
dicted curves were found by taking the P s curve of Fig. 4.2.1.2.2 adjusted by the effective
LO
antenna height gain G effl' due to the ground contour. Figure 4.2.1.3.3 shows the measured data
in San Diego. It was at a site of d1 ::; 200 ft and G A = 0. The predicted curve P os (at A) is drawn
as subtracting the building blockage L8 curve from the P s curve, shown in Fig. 4.2.1.2.2. The
LO
predicted and the measured curves were in agreement. Figure 4.2.1.3.4 shows the mobile
unit run on Jamboree Road from north to south, while the measured data were collected
starting from the Barranca Parkway intersection (on the left of the figure) and ending at the
Michaelson Road intersection (on the right of the figure). The antenna site was located on
Alton v enue. The range d1 on the north side (left side of the figure) was d1 = 500 ft and on
A
the south side (right side of the figure) was d1 ::; 200 ft. The predicted curves (P os (at A)) were
found from Fig. 4.2. . 3.1 for different ranges of d1• Figure 4.2.1.3.5 shows the measured data
1
collected on Alton A v enue from the Jamboree Road intersection to Red Hill A v enue. The
range is d1 = 700 ft, as shown in the figure. The predicted P 0 s (at A) is found from Fig. 4.2.1.3.6
for d1 = 700 ft. The predicted curve and the measured data agree with each other well.
4.2.1.3.2 The Total Length B-The Sum of Individual Building Blockage
Empirical Curve The total length B is the sum of individual building blockage along the
radio path. In some scenarios, the length B can be less than 500 ft. If this happens, the
new path loss L will be less than shown in the measured data. Therefore, an empirical
A
curve was generated for a different length B and a different d1, as shown in Fig. 4.2.1.3.6.
The predicted P 0 s (at A) can be obtained when the values of B and d1 are known.