
Page 220 - Integrated Wireless Propagation Models
P. 220
198 C h a p t e r F o u r
Measured Data Figure 4.2.1 . 3.7 shows the data that were collected while the mobile unit
ran on Von Karman Avenue from south to north. The antenna site was on Main Street,
which was a relatively quiet street. The value of B blockage on the north side was
=
B = 200 ft, corresponding to LA = 8 dB. On the south side, B 3 50 ft, corresponding to
1
LA = 15 dB. The new path losses LA due to the blockage B are found from Fig. 4.2. . 3.6.
The predicted P 0 (at A) after adding LA was obtained from two different blockages of B
5
in two different areas, then plotted in Fig. 4.2.1.3.7 for comparing with the measured
data. They fairly agree with each other.
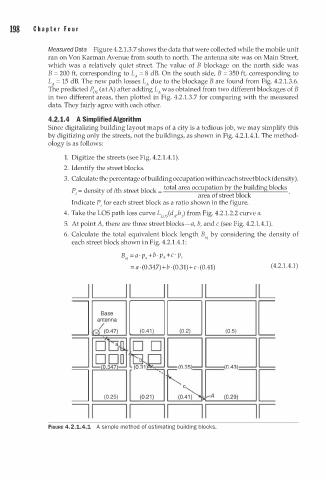
4.2. 1.4 A Simplified Algorithm
Since digitalizing building layout maps of a city is a tedious job, we may simplify this
by digitizing only the streets, not the buildings, as shown in Fig. 4.2.1.4.1. The method
ology is as follows:
1
1. Digitize the streets (see Fig. 4.2. . 4.1).
2. Identify the street blocks.
3. Calculate the percentage of building occupation within each street block (density).
total area occupation by the building blocks
p = densit of ith street block =
1 Y area of street block
Indicate P for each street block as a ratio shown in the figure.
;
1
4. Take the LOS path loss curve L w5 (dA'h ) from Fig. 4.2.1.2.2 curve a.
5. At point A, there are three street blocks-a, b, and c (see Fig. 4.2.1.4.1).
6. Calculate the total equivalent block length Be by considering the density of
q
1
each street block shown in Fig. 4.2. . 4.1:
Be = a · Pa + b · Pb + c · Pc
q
1
= a · (0.347) + b · (0.31) + c · (0.41) ( 4.2. . 4.1)
_j l I I I I I I I L
J ,�::;) D O (0.5) [
] [8! �, 0 0 0 [
-
(02 1 ) LJ.W [
J (0.25)
I I I I I I I I I I
FIGURE 4.2.1.4.1 A simple method of estimating building blocks.