
Page 223 - Integrated Wireless Propagation Models
P. 223
M i c r o c e l l P r e d i c t i o n M o d e l s 201
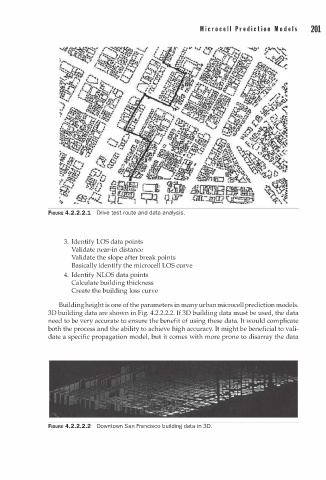
FIGURE 4.2.2.2.1 Drive test route and data analysis.
3. Identify LOS data points
Validate near-in distance
Validate the slope after break points
Basically identify the microcell LOS curve
4. Identify NLOS data points
Calculate building thickness
Create the building loss curve
Building height is one of the parameters in many urban microcell prediction models.
3D building data are shown in Fig. 4.2.2.2.2. If 3D building data must be used, the data
need to be very accurate to ensure the benefit of using these data. It would complicate
both the process and the ability to achieve high accuracy. It might be beneficial to vali
date a specific propagation model, but it comes with more prone to disarray the data
i
FIGURE 4.2.2.2.2 Downtown San Francisco building data n 3D.