
Page 324 - Integrated Wireless Propagation Models
P. 324
302 C h a p t e r F i v e
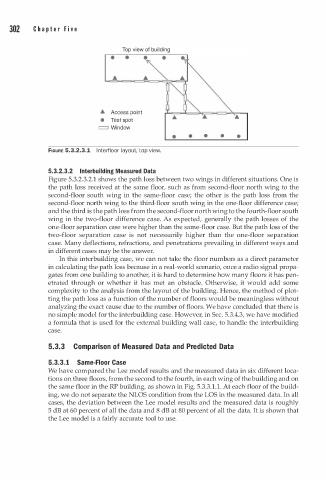
A Access point
• Test spot
c:::::1 Window
• • • • •
FIGURE 5.3.2.3.1 l n terfloor layout, top view.
5.3.2.3.2 lnterbuilding Measured Data
Figure 5.3.2.3.2.1 shows the path loss between two wings in different situations. One is
the path loss received at the same floor, such as from second-floor north wing to the
second-floor south wing in the same-floor case; the other is the path loss from the
second-floor north wing to the third-floor south wing in the one-floor difference case;
and the third is the path loss from the second-floor north wing to the fourth-floor south
wing in the two-floor difference case. As expected, generally the path losses of the
one-floor separation case were higher than the same-floor case. But the path loss of the
two-floor separation case is not necessarily higher than the one-floor separation
case. Many deflections, refractions, and penetrations prevailing in different ways and
in different cases may be the answer.
In this interbuilding case, we can not take the floor numbers as a direct parameter
in calculating the path loss because in a real-world scenario, once a radio signal propa
gates from one building to another, it is hard to determine how many floors it has pen
etrated through or whether it has met an obstacle. Otherwise, it would add some
complexity to the analysis from the layout of the building. Hence, the method of plot
ting the path loss as a function of the number of floors would be meaningless without
analyzing the exact cause due to the number of floors. We have concluded that there is
no simple model for the interbuilding case. However, in Sec. 5.3.4.3, we have modified
a formula that is used for the external building wall case, to handle the interbuilding
case.
5.3.3 Comparison of Measured Data and Predicted Data
3
5.3. . 1 Same-Floor Case
We have compared the Lee model results and the measured data in six different loca
tions on three floors, from the second to the fourth, in each wing of the building and on
the same floor in the RP building, as shown in Fig. 5.3.3 1 . 1 . At each floor of the build
.
ing, we do not separate the NLOS condition from the LOS in the measured data. In all
cases, the deviation between the Lee model results and the measured data is roughly
5 dB at 60 percent of all the data and 8 dB at 80 percent of all the data. It is shown that
the Lee model is a fairly accurate tool to use.