
Page 322 - Integrated Wireless Propagation Models
P. 322
300 C h a p t e r F i v e
being found at the six-floor separations. At 1800 MHz and greater, the two path-loss
slopes are continuous at the transition. Therefore, a correction factor a is
{ 5 dB for 900 MHz and lower
a =
0 for 1800 MHz and higher
A
At 850 MHz, m12 = 10 /log 2 = 33.33 is from Eq. (5.3.2.2.2.6), and a = 5, = 32 - 5 = 27, is
from Eq. (5.3.2.2.2.7): Then Eq. (5.3.2.2.2.5) becomes
L"i- = 33.33 · log [n, . ) + 27 (5.3.2.2.2.8)
f
)
At 2.3 GHz, m12 = 10/log 2 = 33.33, a = 0, and A = 49 are found from Eq. (5.3.2.2.2.7 .
Then
L"i = 33.33 · log [n, . ) + 27 (5.3.2.2.2.9)
1
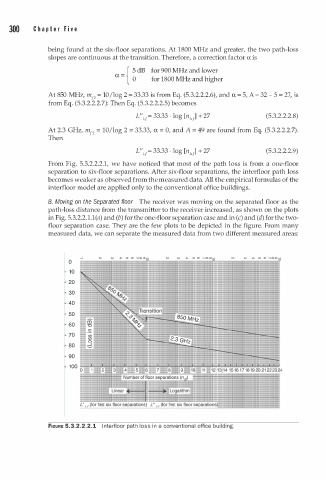
From Fig. 5.3.2.2.2.1, we have noticed that most of the path loss is from a one-floor
separation to six-floor separations. After six-floor separations, the interfloor path loss
becomes weaker as observed from the measured data. All the empirical formulas of the
interfloor model are applied only to the conventional office buildings.
B. Moving on the Separated floor The receiver was moving on the separated floor as the
path-loss distance from the transmitter to the receiver increased, as shown on the plots
in Fig. 5.3.2.2.1.1(a) and (b) for the one-floor separation case and in (c) and (d) for the two
floor separation case. They are the few plots to be depicted in the figure. From many
measured data, we can separate the measured data from two different measured areas:
0
1 0
20
30
40
50
60
70
80
90
1 0 0
FIGURE 5.3.2.2.2.1 l n terfloor path loss n a conventional office building.
i