
Page 317 - Integrated Wireless Propagation Models
P. 317
I n - B u i l d i n g ( P i c o c e l l ) P r e d i c t i o n M o d e l s 295
All north wing data points function of distance
slope = 20.378
40 -
1 1 0 ----��----�----�----�----L---�
-1 -0.5 0 0.5 1.5 2 X
Distance (dec)
All south wing data poi nts function of distance
slope = 20.261
40
50
60
ii)
:s. 70
rJJ
rJJ
_Q
.<:: 80
Cii
0...
90
1 0 0
1 1 0
-1 -0.5 0 0.5 1.5 2 X
Distance (dec)
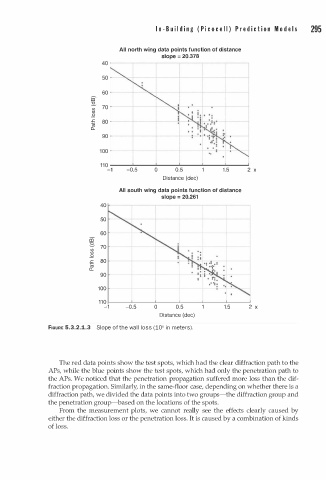
FIGURE 5.3.2.1.3 Slope of the wal l loss (10x i n meters).
The red data points show the test spots, which had the clear diffraction path to the
APs, while the blue points show the test spots, which had only the penetration path to
the APs. We noticed that the penetration propagation suffered more loss than the dif
fraction propagation. Similarly, in the same-floor case, depending on whether there is a
diffraction path, we divided the data points into two groups-the diffraction group and
the penetration group-based on the locations of the spots.
From the measurement plots, we cannot really see the effects clearly caused by
either the diffraction loss or the penetration loss. It is caused by a combination of kinds
of loss.