
Page 316 - Integrated Wireless Propagation Models
P. 316
294 C h a p t e r F i v e
South Tower
/ windows
R4 I "' R1� 3'd-Ch 11 R11 R14 R 1 6
p
R9 �� R18
"
- -
Door \ Thickness of walls
2"d-Ch 6 2"d-Ch 1 2nd -Ch 11
r
3 rLCh 11 3 rLCh 6 3 d -Ch 1 Door
41h-Ch 6 41h -Ch 1 4th -Ch 11
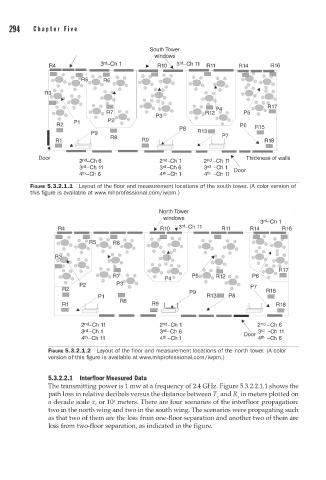
FIGURE 5.3.2.1.1 Layout of the floor and measurement locations of the south tower. (A color version of
this figure is available at www.mhprofessional.com i wpm. )
j
P2
g
P1 - p
R1 R8
- : �
1
2"d-Ch 1 2"d-Ch 1 \ 2 " d -Ch 6
r
3'LCh 1 3'LCh 6 Door 3 d -Ch 1 1
t
4th-Ch 1 1 4th -Ch 1 4 h -Ch 6
FIGURE 5.3.2.1.2 Layout of the floor and measurement locations of the north tower. (A color
version of this figure is available at www.mhprofessional.comjiwpm. )
2
5.3.2. . 1 lnterfloor Measured Data
The transmitting power is 1 mw at a frequency of 2.4 GHz. Figure 5.3.2.2.1.1 shows the
path loss in relative decibels versus the distance between T and R in meters plotted on
x
x
x
a decade scale x, or 10 meters. There are four scenarios of the interfloor propagation:
two in the north wing and two in the south wing. The scenarios were propagating such
as that two of them are the loss from one-floor separation and another two of them are
loss from two-floor separation, as indicated in the figure.