
Page 329 - Integrated Wireless Propagation Models
P. 329
I n - B u i l d i n g ( P i c o c e l l ) P r e d i c t i o n M o d e l s 307
Data Points of FDTD, 3D Ray Tracing Lee Model and Measurement CDFs of FDTD, 3D Ray Tracing and Lee Model to Measurement
100 ' -- � == �
-110 r-:---==:=----,---------------, - , , . - - - - - - - --- ,
FDTD
- - - - - - - - - -
-100
Jj -95
"0
-�
£
g> -90
!!!
Ui
c;;
c:
g -85
-80
-75
10 20
Point number Difference in dB
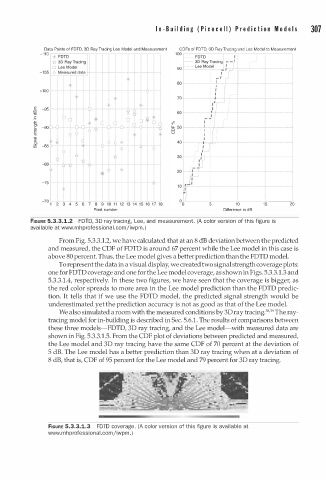
fiGURE 5.3.3.1.2 FDTD, 3D ray tracing, Lee, and measurement. (A color version of this figure is
available at www.mhprofessiona . c omjiwpm. )
l
From Fig. 5.3.3.1.2, we have calculated that at an 8 dB deviation between the predicted
and measured, the COF of FOTO is around 67 percent while the Lee model in this case is
above 80 percent. Thus, the Lee model gives a better prediction than the FOID model.
To represent the data in a visual display, we created two signal strength coverage plots:
one for FDTO coverage and one for the Lee model coverage, as shown in Figs. 5.3.3.1.3 and
5.3.3.1.4, respectively. In these two figures, we have seen that the coverage is bigger, as
the red color spreads to more area in the Lee model prediction than the FOTO predic
tion. It tells that if we use the FOTO model, the predicted signal strength would be
underestimated yet the prediction accuracy is not as good as that of the Lee model.
We also simulated a room with the measured conditions by 30 ray tracing.38•39 The ray
tracing model for in-building is described in Sec. 5.6. . The results of comparisons between
1
these three models-FOID, 30 ray tracing, and the Lee model-with measured data are
shown in Fig. 5.3.3. . 5. From the COF plot of deviations between predicted and measured,
1
the Lee model and 30 ray tracing have the same COF of 70 percent at the deviation of
5 dB. The Lee model has a better prediction than 30 ray tracing when at a deviation of
8 dB, that is, COF of 95 percent for the Lee model and 79 percent for 30 ray tracing.
fiGURE 5.3.3.1.3 FDTD coverage. (A color version of this figure is available at
www.mhprofessional.comjiwpm. )