
Page 332 - Integrated Wireless Propagation Models
P. 332
310 C h a p t e r F i v e
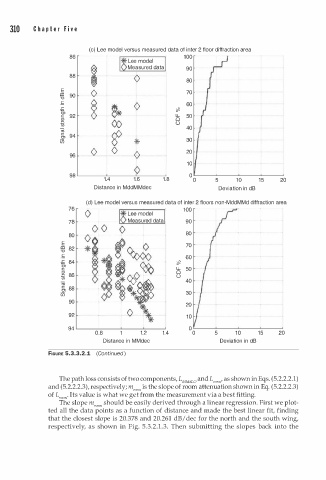
(c) Lee model versus measured data of inter 2 floor diffraction area
86 1 0 0
Lee model
Measured data 90
� 0 80
88
E 70
((] 90 0
""0
-� 60
.r: 0 �
0, � 0
c 92 § LL 50
� 0
(j) (;() 0
(ij 40
c
Ol 94
i:/5 � * 30
96 0 0 0 20
1 0
0
98 0
1.4 1.6 1.8 0 5 1 0 1 5 20
Distance in MddMMdec Deviation in dB
(d) Lee model versus measured data of inter 2 floors non-MddMMd diffraction area
76 1 0 0
0 Lee model
78 Measured data 90
0 0 0
80 80
0
E 70
((] 82 f o
""0 * o
c 60
.r: 84 \O<>o �
0, 0
c � <& % LL 50
_!g 86 0
0
(/) 40
(ij
§, 88
i:/5 30
90 � * � 20
92 o \ 1 0
94 0
0.8 1.2 1.4 0 5 1 0 1 5 20
Distance in MMdec Deviation in dB
fiGURE 5.3.3.2.1 (Continued )
The path loss consists of two components, L MMdLO and L room' as shown in Eqs. (5.2.2.2.1)
and (5.2.2.2.3), respectively; m,oom is the slope of room attenuation shown in Eq. (5.2.2.2.3)
of L,oom· Its value is what we get from the measurement via a best fitting.
The slope m room should be easily derived through a linear regression. First we plot
ted all the data points as a function of distance and made the best linear fit, finding
that the closest slope is 20.378 and 20.261 dB/ dec for the north and the south wing,
respectively, as shown in Fig. 5.3. . 1 . 3 . Then submitting the slopes back into the
2