Page 330 - Integrated Wireless Propagation Models
P. 330

308    C h a p t e r  F i v e


               FIGURE 5.3.3.1.4  Lee model coverage. (A color version of this figure is available at
               www.mhprofessional.comjiwpm. )


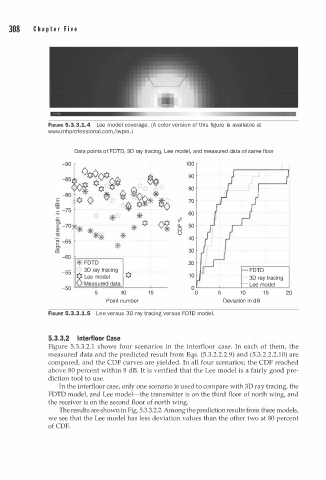
                       Data points  f   FDTD, 3D ray tracing, Lee model, and measured data  f   same floor
                               o
                                                                       o
                   -90                                 1 0 0
                         o oO  oo                       90
                         ¢ 0  ifJ           �
                         *    0        �                80
                       o  o      �  � � � * �           70
                                                        60
                                 *       *           �
                                                     0
                                       *  0          LL.  50
                                               �     0
                                                     0
                          * **      *                   40
                 � -65
                 0>               *
                 Ui                                     30
                   -60
                       * FDTD                           20
                   -55   3D ray tracing                                - FDTD
                          Lee model   0                 1 0              3D ray tracing
                          Measured data                                - Lee model
                   -50                                   0
                             5      1 0     1 5           0     5      1 0    1 5    20
                                Point number                      Deviation in  B
                                                                          d
               FIGURE 5.3.3.1.5  Lee versus 3D ray tracing versus FDTD model .

               5.3.3.2  lnterfloor Case
               Figure 5.3.3.2.1 shows four scenarios in the interfloor case. In each of them, the
               measured data and the predicted result from Eqs. (5.3.2.2.2.9) and (5.3.2.2.2.10) are
               compared, and the CDF curves are yielded. In all four scenarios; the CDF reached
               above 80 percent within 8 dB. It is verified that the Lee model is a fairly good pre­
               diction tool to use.
                  In the interfloor case, only one scenario is used to compare with 3D ray tracing, the
               FDTD model, and Lee model-the transmitter is on the third floor of north wing, and
               the receiver is on the second floor of north wing.
                  The results are shown  in Fig. 5.3.3.2.2. Among the prediction results from three models,
               we see that the Lee model has less deviation values than the other two at 80 percent
               of CDF.
   325   326   327   328   329   330   331   332   333   334   335