
Page 338 - Integrated Wireless Propagation Models
P. 338
316 C h a p t e r F i v e
1 1 0 - - - - - 1 0 0
* FDTD - FDTD
u 3D ray tracing - 3D ray tracing
1 0 8 Lee model 90 Lee model
Angle formula Angle formula
t
1 0 6 Measured data 80
1 0 4 u 70
u
((] [P] Lee, purple color
""0 1 0 2 u 60 [B] Angle, blue color
-� �
(/) 0 LL
(/)
_Q 1 0 0' ¢ ¢ 4 0 50
£ * * � 0
Cii 98 � f'
c... * 40
u
t
96 30
y
,. * u
94 20
92 t 1 0
*
90
1 2 3 4 5 6 7 8 5 1 0 1 5 20
Point number Deviation in dB
(c)
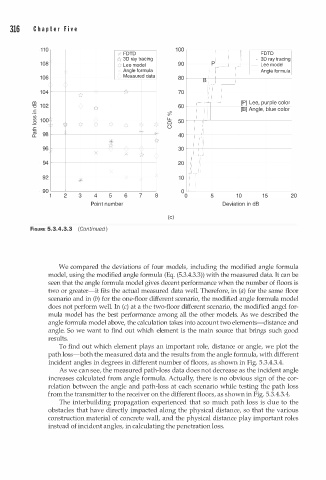
FIGURE 5.3.4.3.3 (Continued )
We compared the deviations of four models, including the modified angle formula
model, using the modified angle formula (Eq. (5.3.4.3.3)) with the measured data. It can be
seen that the angle formula model gives decent performance when the number of floors is
two or greater-it fits the actual measured data well. Therefore, in (a) for the same floor
scenario and in (b) for the one-floor different scenario, the modified angle formula model
does not perform well. In (c) at a the two-floor different scenario, the modified angel for
mula model has the best performance among all the other models. As we described the
angle formula model above, the calculation takes into account two elements-distance and
angle. So we want to find out which element is the main source that brings such good
results.
To find out which element plays an important role, distance or angle, we plot the
path loss-both the measured data and the results from the angle formula, with different
incident angles in degrees in different number of floors, as shown in Fig. 5.3.4.3.4.
As we can see, the measured path-loss data does not decrease as the incident angle
increases calculated from angle formula. Actually, there is no obvious sign of the cor
relation between the angle and path-loss at each scenario while testing the path loss
from the transmitter to the receiver on the different floors, as shown in Fig. 5.3.4.3.4.
The interbuilding propagation experienced that so much path loss is due to the
obstacles that have directly impacted along the physical distance, so that the various
construction material of concrete wall, and the physical distance play important roles
instead of incident angles, in calculating the penetration loss.