
Page 365 - Integrated Wireless Propagation Models
P. 365
T h e l e e C o m p r e h e n s i v e M o d e l - I n t e g r a t i o n o f t h e T h r e e l e e M o d e l s 343
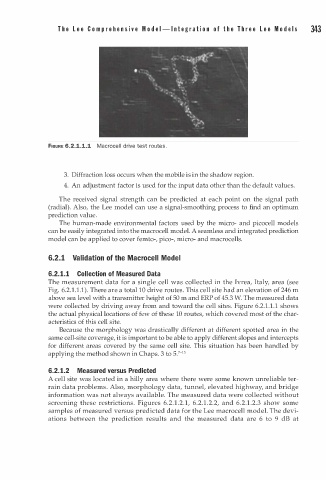
FIGURE 6.2.1.1.1 Macrocel l drive test routes.
3. Diffraction loss occurs when the mobile is in the shadow region.
4. An adjustment factor is used for the input data other than the default values.
The received signal strength can be predicted at each point on the signal path
(radial). Also, the Lee model can use a signal-smoothing process to find an optimum
prediction value.
The human-made environmental factors used by the micro- and picocell models
can be easily integrated into the macrocell model. A seamless and integrated prediction
model can be applied to cover femto-, pico-, micro- and macrocells.
6. . 1 Validation of the Macrocell Model
2
6.2. 1 . 1 Collection of Measured Data
The measurement data for a single cell was collected in the Ivrea, Italy, area (see
Fig. 6.2 1 . 1 . 1 ) . There are a total 10 drive routes. This cell site had an elevation of 246 m
.
above sea level with a transmitter height of 50 m and ERP of 45.3 W. The measured data
were collected by driving away from and toward the cell sites. Figure 6.2 1 . 1 . 1 shows
.
the actual physical locations of few of these 10 routes, which covered most of the char
acteristics of this cell site.
Because the morphology was drastically different at different spotted area in the
same cell-site coverage, it is important to be able to apply different slopes and intercepts
for different areas covered by the same cell site. This situation has been handled by
1
applying the method shown in Chaps. 3 to 5.7- 5
6.2. 1.2 Measured versus Predicted
A cell site was located in a hilly area where there were some known unreliable ter
rain data problems. Also, morphology data, tunnel, elevated highway, and bridge
information was not always available. The measured data were collected without
6
screening these restrictions. Figures 6.2.1 . 2 . 1 , 6 . 2 . 1 .2.2, and . 2 . 1 .2.3 show some
samples of measured versus predicted data for the Lee macrocell model. The devi
ations between the prediction results and the measured data are 6 to 9 dB at