
Page 370 - Integrated Wireless Propagation Models
P. 370
348 C h a p t e r S i x
...
+ �
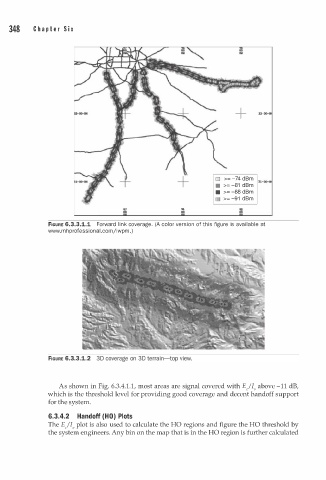
D >= -74 dBm ,_
• >= -81 dBm
• >= -88 dBm
• >= -91 dBm
91 ,. ..
..
FIGURE 6.3.3.1.1 Forward link coverage. (A color version of this figure is available at
www.mhprofessional.com/iwpm. )
-
A s shown in Fig. 6.3.4.1.1, most areas are signal covered with E/Io above 1 1 dB,
which is the threshold level for providing good coverage and decent handoff support
for the system.
6.3.4.2 Handoff (HO) Plots
The E/Io plot is also used to calculate the HO regions and figure the HO threshold by
the system engineers. Any bin on the map that is in the HO region is further calculated