
Page 372 - Integrated Wireless Propagation Models
P. 372
350 C h a p t e r S i x
+
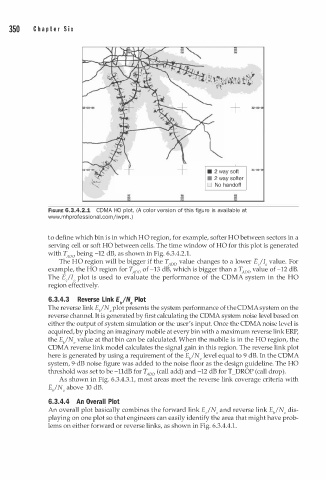
• 2 way soft
• 2 way softer
D No handoff
FIGURE 6.3.4.2.1 COMA HO plot. (A color version of this figure is available at
www.mhprofessional.comjiwpm. )
H
i
t o define which bin s in which O region, for example, softer O between sectors in a
H
serving cell or soft HO between cells. The time window of HO for this plot is generated
with T A oo being -12 dB, as shown in Fig. 6.3.4.2.1.
The HO region will be bigger if the T A oo value changes to a lower Ejlo value. For
example, the HO region for T A oo of -13 dB, which is bigger than a T A oo value of -12 dB.
The E/ Io plot is used to evaluate the performance of the CDMA system in the HO
region effectively.
6.3.4.3 Reverse Link EJN. Plot
The reverse link E/ No plot presents the system performance of the CDMA system on the
reverse channel. It is generated by first calculating the CDMA system noise level based on
either the output of system simulation or the user's input. Once the CDMAnoise level is
acquired, by placing an imaginary mobile at every bin with a maximum reverse link ERP,
the E/No value at that bin can be calculated. When the mobile is in the HO region, the
CDMA reverse link model calculates the signal gain in this region. The reverse link plot
here is generated by using a requirement of the E/No level equal to 9 dB. In the CDMA
system, 9-dB noise figure was added to the noise floor as the design guideline. The HO
threshold was set to be -lldB for T A oo (call add) and -12 dB for T_DROP (call drop).
As shown in Fig. 6.3.4.3.1, most areas meet the reverse link coverage criteria with
E/No above 10 dB.
6.3.4.4 An Overall Plot
An overall plot basically combines the forward link EjNo and reverse link E/No dis
playing on one plot so that engineers can easily identify the area that might have prob
1
lems on either forward or reverse links, as shown in Fig. 6.3.4.4. .