
Page 376 - Integrated Wireless Propagation Models
P. 376
354 C h a p t e r S i x
6.3.5.2 Studying Design Plots in a Special Area before Using Repeaters
In this section, several CDMA design plots are shown in Figs. 6.3.5.2.1 to 6.3.5.2.5. before
the repeater is implemented that is used as the benchmark for comparison
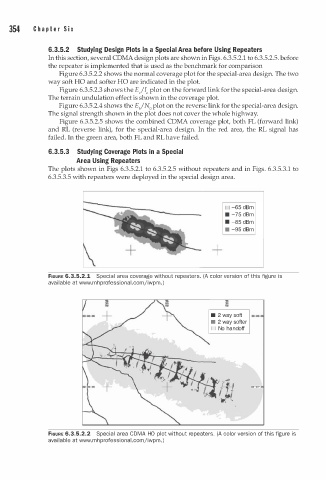
Figure 6.3.5.2.2 shows the normal coverage plot for the special-area design. The two
way soft HO and softer HO are indicated in the plot.
Figure 6.3.5.2.3 shows the Ejlo plot on the forward link for the special-area design.
The terrain undulation effect is shown in the coverage plot.
Figure 6.3.5.2.4 shows the E/N plot on the reverse link for the special-area design.
0
The signal strength shown in the plot does not cover the whole highway.
Figure 6.3.5.2.5 shows the combined CDMA coverage plot, both FL (forward link)
and RL (reverse link), for the special-area design. In the red area, the RL signal has
failed. In the green area, both FL and RL have failed.
6.3.5.3 Studying Coverage Plots in a Special
Area Using Repeaters
The plots shown in Figs 6.3.5.2.1 to 6.3.5.2.5 without repeaters and in Figs. 6.3.5.3.1 to
6.3.5.3.5 with repeaters were deployed in the special design area.
D -65 dBm
• -75 dBm
• -85 dBm
• -95 dBm
+
FIGURE 6.3.5.2.1 Special area coverage without repeaters. (A color version of this figure is
a
av i lable at www.mhprofessional.comjiwpm. )
• 2 way soft
• 2 way softer
D No handoff
.......
FIGURE 6.3.5.2.2 Special area COMA HO plot without repeaters. (A color version of this figure is
a
av i lable at www.mhprofessional.com/iwpm. )