
Page 380 - Integrated Wireless Propagation Models
P. 380
358 C h a p t e r S i x
Good coverage
RL Eb/N0 failed
Ec/10, RL Eb/N0 failed
FIGURE 6.3.5.3.5 Special-area combined plot with repeaters. (A color version of this figure is
a
av i lable at www.mhprofessional.comjiwpm. )
i
system s the output power. The microcell system supports much higher power than the
repeater (usually the maximum output power for a repeater is 2 W and for microcells
can be up to a much higher power of 10 W).
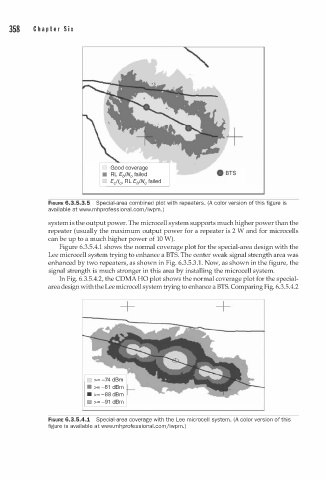
Figure 6.3.5.4.1 shows the normal coverage plot for the special-area design with the
Lee microcell system trying to enhance a BTS. The center weak signal strength area was
enhanced by two repeaters, as shown in Fig. 6.3.5.3.1. Now, as shown in the figure, the
signal strength is much stronger in this area by installing the microcell system.
In Fig. 6.3.5.4.2, the COMA HO plot shows the normal coverage plot for the special
area design with the Lee microcell system trying to enhance a BTS. Comparing Fig. 6.3.5.4.2
+ +
• >= -81 dBm
• >= -88 dBm
• >= -91 dBm
FIGURE 6.3.5.4.1 Special-area coverage with the Lee microcell syste . (A color version of this
m
figure is av i l able at www.m h p rofessional.com/iwpm.)
a