
Page 384 - Integrated Wireless Propagation Models
P. 384
362 C h a p t e r S i x
+ + + +
0 >= -74 dBm
• >= -81 dBm
• >= -88 dBm
• >= -91 dBm + + +
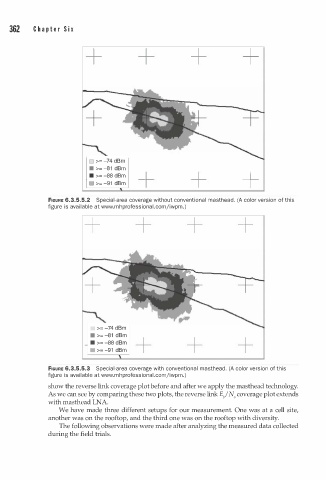
FIGURE 6.3.5.5.2 Special-area coverage without conventional masthead. (A color version of this
a
a
figure is av i lable at www.m h p rofession l . c omjiwpm.)
+ + + +
• >= -91 dBm + + +
FIGURE 6.3.5.5.3 Special-area coverage with conventional masthead. (A color version of this
figure is av i lable at www.m h p rofessional.comjiwpm.)
a
show the reverse link coverage plot before and after we apply the masthead technology.
As we can see by comparing these two plots, the reverse link E/ N0 coverage plot extends
with masthead LNA.
We have made three different setups for our measurement. One was at a cell site,
another was on the rooftop, and the third one was on the rooftop with diversity.
The following observations were made after analyzing the measured data collected
during the field trials.