
Page 382 - Integrated Wireless Propagation Models
P. 382
360 C h a p t e r S i x
+ +
D
•
•
D
• >= 8 dB
• >= 6 dB
• >= 4 dB
m
e
FIGURE 6.3.5.4.4 Special-area CDMA reverse link E0/N0 with i croc l l . (A color version of this
figure is available at www.mhprofession l . c omjiwpm.)
a
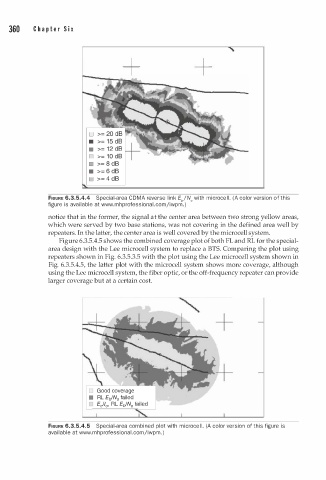
notice that in the former, the signal at the center area between two strong yellow areas,
which were served by two base stations, was not covering in the defined area well by
repeaters. In the latter, the center area is well covered by the microcell system.
Figure 6.3.5.4.5 shows the combined coverage plot of both FL and RL for the special
area design with the Lee microcell system to replace a BTS. Comparing the plot using
repeaters shown in Fig. 6.3.5.3.5 with the plot using the Lee microcell system shown in
Fig. 6.3.5.4.5, the latter plot with the microcell system shows more coverage, although
using the Lee microcell system, the fiber optic, or the off-frequency repeater can provide
larger coverage but at a certain cost.
Good coverage
RL Eb/N0 failed
Ecl/0, RL Eb/N0 failed
e
m
FIGURE 6.3.5.4.5 Special-area combined plot with i croc l l . (A color version of this figure is
a
av i lable at www.mhprofessional.comjiwpm. )