
Page 381 - Integrated Wireless Propagation Models
P. 381
T h e l e e C o m p r e h e n s i v e M o d e l - I n t e g r a t i o n o f t h e T h r e e l e e M o d e l s 359
+
+
e
m
FIGURE 6.3.5.4.2 Special-area COMA HO plot with i croc l l . (A color version of this figure is
a
av i lable at www.mhprofessional.comjiwpm. )
+
> = -7 B
d
• > = -9 d B
D >= -11 dB
• >= -13 d B
• >= -15 dB
• >= -17 d B
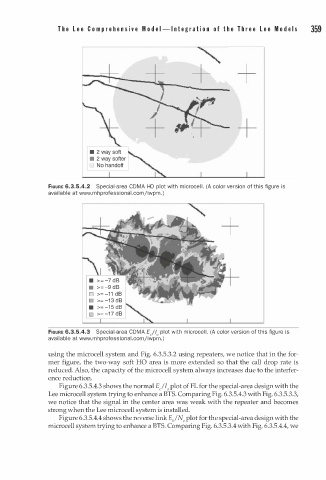
FIGURE 6.3.5.4.3 Special-area COMA Ec/10 plot with i croc l l . (A color version of this figure is
e
m
available at www.mhprofessional.comjiwpm.)
using the microcell system and Fig. 6.3.5.3.2 using repeaters, we notice that in the for
mer figure, the two-way soft HO area is more extended so that the call drop rate is
reduced. Also, the capacity of the microcell system always increases due to the interfer
ence reduction.
Figure 6.3.5.4.3 shows the normal Ej Io plot of FL for the special-area design with the
Lee microcell system trying to enhance a BTS. Comparing Fig. 6.3.5.4.3 with Fig. 6.3.5.3.3,
we notice that the signal in the center area was weak with the repeater and becomes
strong when the Lee microcell system is installed.
Figure 6.3.5.4.4 shows the reverse link E/No plot for the special-area design with the
microcell system trying to enhance a BTS. Comparing Fig. 6.3.5.3.4 with Fig. 6.3.5.4.4, we