
Page 383 - Integrated Wireless Propagation Models
P. 383
T h e l e e C o m p r e h e n s i v e M o d e l - I n t e g r a t i o n o f t h e T h r e e l e e M o d e l s 361
6.3.5.5 Special-Area Design Using Masthead LNA23·27
The masthead LNA can provide a better noise figure value in a long cable (big cable
loss) extension environment. In this environment, the antenna is usually high, and it
would improve the performance of a rural cell site.
Before designing a system by implanting masthead LNA, a noise figure (NF) model
should be used. This NF model can calculate the noise figure and gain in different set
ups of a cable length with the LNA and the filter. We can show a quick analysis of the
performance of a specific setup before the actual hardware is deployed. It can also pro
vide solutions based on a specific noise figure requirement.
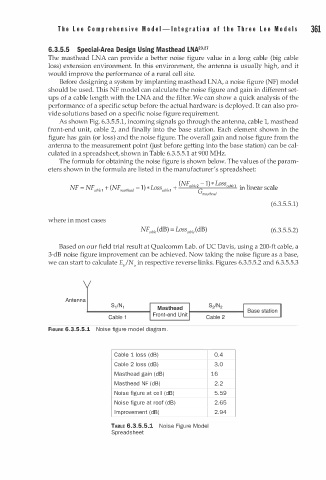
As shown Fig. 6.3.5.5.1, incoming signals go through the antenna, cable 1, masthead
front-end unit, cable 2, and finally into the base station. Each element shown in the
figure has gain (or loss) and the noise figure. The overall gain and noise figure from the
antenna to the measurement point (just before getting into the base station) can be cal
culated in a spreadsheet, shown in Table 6.3.5.5.1 at 900 MHz.
The formula for obtaining the noise figure is shown below. The values of the param
eters shown in the formula are listed in the manufacturer's spreadsheet:
(NFcableZ - 1) * L
NF NF cablel + (NF mastltead - * OSS cablel + oss cable l in linear scale
1) L
=
G mastlle n d
(6.3.5.5.1)
where in most cases
( 6.3.5.5.2)
Based on our field trial result at Qualcomm Lab. of UC Davis, using a 200-ft cable, a
3-dB noise figure improvement can be achieved. Now taking the noise figure as a base,
we can start to calculate E/No in respective reverse links. Figures 6.3.5.5.2 and 6.3.5.5.3
Antenna
Masthead
Cable 1 Front-end Unit Cable 2
FIGURE 6.3.5.5.1 Noise figure model diagr m .
a
Cable 1 1oss (dB) 0.4
Cable 2 loss (dB) 3.0
i
Masthead ga n (dB) 16
Masthead F (dB) 2 . 2
N
Noise figure at ce l (dB) 5 . 5 9
l
Noise figure at roof (dB) 2 . 65
I m provement (dB) 2 . 94
TABLE 6.3.5.5.1 Noise Figure Model
Spreadsheet