
Page 388 - Integrated Wireless Propagation Models
P. 388
366 C h a p t e r S i x
Macro
Tx
*
1 2
1 3 11
4
1 1 0
1 5 •
1 6 • • •
1 7 .
18 contour
19 ;•
•
20 /
l
i
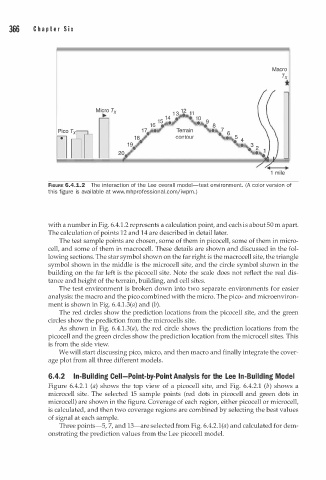
FIGURE 6.4.1.2 The n teraction of the Lee overa l model-test environment. (A color version of
this figure is available at www.mhprofessional.com i wpm. )
j
with a number in Fig. 6.4. . 2 represents a calculation point, and each s about 0 m apart.
1
i
5
The calculation of points 12 and 14 are described in detail later.
The test sample points are chosen, some of them in picocell, some of them in micro
cell, and some of them in macrocell. These details are shown and discussed in the fol
lowing sections. The star symbol shown on the far right is the macrocell site, the triangle
symbol shown in the middle is the microcell site, and the circle symbol shown in the
building on the far left is the picocell site. Note the scale does not reflect the real dis
tance and height of the terrain, building, and cell sites.
The test environment is broken down into two separate environments for easier
analysis: the macro and the pico combined with the micro. The pico- and microenviron
ment is shown in Fig. 6.4.1.3(a) and (b).
The red circles show the prediction locations from the picocell site, and the green
circles show the prediction from the microcells site.
As shown in Fig. 6.4.1.3(a), the red circle shows the prediction locations from the
picocell and the green circles show the prediction location from the microcell sites. This
is from the side view.
We will start discussing pico, micro, and then macro and finally integrate the cover
age plot from all three different models.
6.4.2 In-Building Cell-Point-by-Point Analysis for the Lee In-Buil i n g Model
d
Figure 6.4.2.1 (a) shows the top view of a picocell site, and Fig. 6.4.2.1 (b) shows a
microcell site. The selected 15 sample points (red dots in picocell and green dots in
microcell) are shown in the figure. Coverage of each region, either picocell or microcell,
is calculated, and then two coverage regions are combined by selecting the best values
of signal at each sample.
Three points-5, 7, and 13-are selected from Fig. 6.4.2.1(a) and calculated for dem
onstrating the prediction values from the Lee picocell model.