
Page 392 - Integrated Wireless Propagation Models
P. 392
370 C h a p t e r S i x
The RSSI at Point 13 is
Transmitter power (0 dBm) - L = 0 dBm - 111.73 dB = -111.73 dBm
Follow the same calculations to find the, predicted RSSis of all the 15 sample
points-interbuilding, four points; interfloor, six points; and throughout from building,
five points-from the Lee in-building model. Since from Sec. 5.6.2.3 we have seen the
performance of the Lee in-building model is matched better with the measured data
than that of the ray-tracing model and FDTD model, here we just give the readers a
picture by calculating the RSSI values of 15 sample points from both the 3D ray-tracing
and the FDTD models using the same virtual environment.
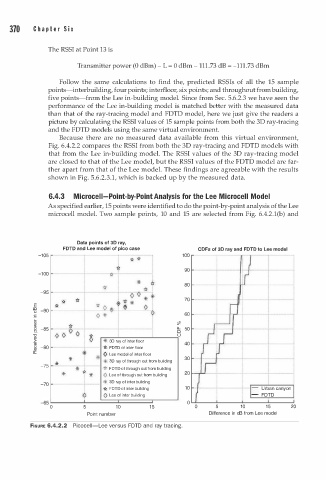
Because there are no measured data available from this virtual environment,
Fig. 6.4.2.2 compares the RSSI from both the 3D ray-tracing and FDTD models with
that from the Lee in-building model. The RSSI values of the 3D ray-tracing model
are closed to that of the Lee model, but the RSSI values of the FDTD model are far
ther apart from that of the Lee model. These findings are agreeable with the results
shown in Fig. 5.6.2.3.1, which is backed up by the measured data.
6.4.3 Microceii-Point-by-Point Analysis for the Lee i crocell Model
M
As specified earlier, 15 points were identified to do the point-by-point analysis of the Lee
microcell model. Two sample points, 10 and 15 are selected from Fig. 6.4.2.1(b) and
Data points of 3D ray,
FDTD and Lee model of pico case CDFs of 3D ray and FDTD to Lee model
-1 05 100
90 _l_
-1 00
80
-95
70
v
E v
!eJ -90
.S 60
:;; <;'!
:;::: lL 50
8. -85 0
"0 ()
� * 3D ray of inter floor
"iii 40
� -80 -s:l FDTD of inter floor
0:: * () Lee model of inter floor
* • · : • 3D ray of through out from building 30
-75 *
* 1"t FDTD of through out from building
* w * () Lee of through out from building 20
-70 iiO 3D ray of inter building
tl FDTD of inter building 1 0 - U r ban canyon
() Lee of inter building - FDTD
-6s L _ _ ......�..._....::==:::c::== == == �-__J 0
0 5 10 1 5 0 5 10 1 5 20
Point number Difference in dB from Lee model
FtGURE 6.4.2.2 Picoceii-Lee versus FDTD and ray tracing.