
Page 394 - Integrated Wireless Propagation Models
P. 394
372 C h a p t e r S i x
Data points of 3D ray,
FDTD and Lee model CDFs of 3D ray and FDTD to Lee model
-65
-70
. 0
-75
0 0
0 0
0
E
OJ -80 •
"0
0
.!: f
.s:::: -85 ll< 0 ;?.
0, v
c 0 lL
0
� .:r
u; -90 u
(ij 0
c * v
"' 0 *
ii5 -95 v
0
-1 00 1)- .,..
1
- 0 5
-11 o"L_..__..__..___.___.___.__.__.__.__.__.__._�
1 2 3 4 5 6 7 8 9 10 1 1 1 2 1 3 1 4 1 5
Distance i n dec Difference in dB
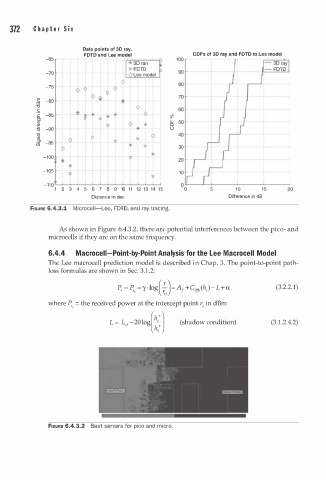
FIGURE 6.4.3.1 Microceii-Lee, FDTD, and ray tracing.
As shown in Figure 6.4.3.2, there are potential interferences between the pico- and
microcells if they are on the same frequency.
6.4.4 Macroceii-Point-by-Point Analysis for the Lee Macrocell Model
The Lee macrocell prediction model is described in Chap. 3. The point-to-point path
loss formulas are shown in Sec. 3.1.2:
P, = P,, - y · log(�) - A 1 + G efll,(he) - L + a (3.2.2.1)
where P , = the received power at the intercept point r in dBm
, 0
L � Lv - 2 0 l og[:::) (ehadow condition) (3 1 . 2.4.2)
.
FIGURE 6.4.3.2 Best servers for pico and i cro.
m