
Page 390 - Integrated Wireless Propagation Models
P. 390
368 C h a p t e r S i x
90
50 50 50 1 5 35 60 40
( ) �--� �-----') � �(-� �------') �----')
1 0 0 meters
300 meters
(a)
3
0 � 0 G G 0 Micro
90 • 90
601 �60 @
0
G
0 0 G
50 50 50 1 5 35 60 40
( ) �-----? �-----') � � �---� ( )
1 0 0 meters
300 meters
(b)
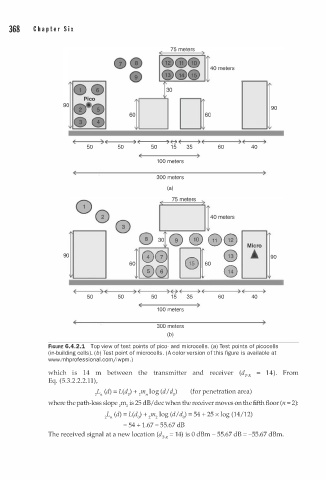
FIGURE 6.4.2.1 Top view of test points of pico- and i crocells. (a) Test points of picocells
m
(in-building cells). (b) Test point of microcells. (A color version of this figure is av i lable at
a
www.mhprofessional.comjiwpm. )
which i s 14 m between the transmitter and receiver (d · R = 1 4 ) . From
T
Eq. (5.3.2.2.2.11),
2 L" (d) = L(d0) + 2 m" log (d I d0) (for penetration area)
where the path-loss slope 211Lz is 25 dB/ dec when the receiver moves on the fifth floor (n = 2):
2 L" (d) = L(d0) + 2m2 log (d/ d0) = 54 + 25 x log (14/12)
= 54 + . 67 = 55.67 dB
1
The received signal at a new location (d .R = 14) is 0 dBm - 55.67 dB = -55.67 dBm.
T