
Page 385 - Integrated Wireless Propagation Models
P. 385
T h e l e e C o m p r e h e n s i v e M o d e l - I n t e g r a t i o n o f t h e T h r e e l e e M o d e l s 363
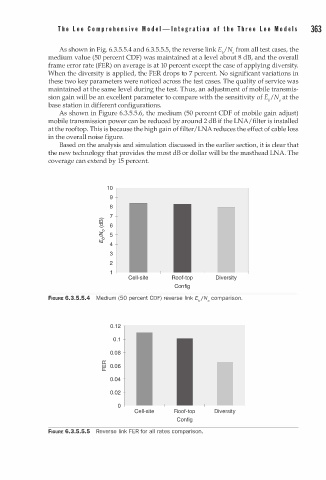
As shown in Fig. 6.3.5.5.4 and 6.3.5.5.5, the reverse link E/No from all test cases, the
medium value (50 percent CDF) was maintained at a level about 8 dB, and the overall
frame error rate (FER) on average is at 10 percent except the case of applying diversity.
When the diversity is applied, the FER drops to 7 percent. No significant variations in
these two key parameters were noticed across the test cases. The quality of service was
maintained at the same level during the test. Thus, an adjustment of mobile transmis
sion gain will be an excellent parameter to compare with the sensitivity of E/No at the
base station in different configurations.
As shown in Figure 6.3.5.5.6, the medium (50 percent CDF of mobile gain adjust)
mobile transmission power can be reduced by around 2 dB if the LNA/filter is installed
at the rooftop. This is because the high gain of filter /LNA reduces the effect of cable loss
in the overall noise figure.
Based on the analysis and simulation discussed in the earlier section, it is clear that
the new technology that provides the most dB or dollar will be the masthead LNA. The
coverage can extend by 15 percent.
1 0
9
8
7
co
::<:::. 6
c
<: 5
�
4
3
2
Cell-site Roof-top Diversity
Con fig
FIGURE 6.3-5.5-4 Medium (50 percent CDF) reverse link Eb/N0 comparison.
0 . 1
0.08
a:
tJ: 0.06
0.04
0.02
0
Cell-site Roof-top Diversity
Config
FIGURE 6.3.5.5.5 Reverse link FER for all rates comparison.