
Page 234 - Intelligent Digital Oil And Gas Fields
P. 234
184 Intelligent Digital Oil and Gas Fields
• Transform the wellhead pressure to down-hole pressure using correlated
multiphase flow equations (e.g., Duns and Ross).
• Update the well performance analysis (nodal analysis) with average
values and build the IPR test. Depending on the model, reservoir pres-
sure, skin, and permeability are known parameters.
• Tune the model-tuning and multiphase flow equations and update.
5.5.1 Key Performance Indicators for Well Tests
Well flowing above critical condition. In gas and gas condensate wells, Turner and
Coleman equations are generally used to estimate the critical gas rate (Q gc ).
The ratio of the current gas rate divided by the critical gas rate (Q g /Q gc )
should be used as a KPI and should be >1.0, which indicates that the well
has no issues with liquid loading and production slugging. The test could be
performed at a higher rate over the Q gc .
Well flowing at stable condition after each flow. When the pump frequency or
choke setting is changed, the changes in pressure over time (δp/δt) should be
equal to zero (steady-state flow or a constant (pseudo-steady state). How-
ever, when δp/δt>0.0, the flow is unsteady state and changes to the choke
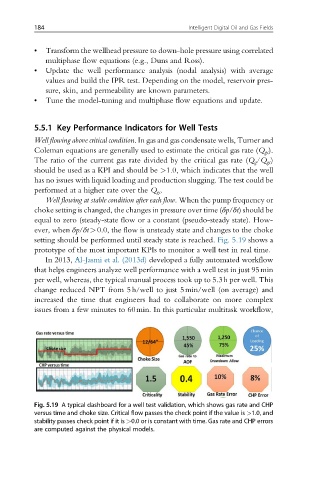
setting should be performed until steady state is reached. Fig. 5.19 shows a
prototype of the most important KPIs to monitor a well test in real time.
In 2013, Al-Jasmi et al. (2013d) developed a fully automated workflow
that helps engineers analyze well performance with a well test in just 95min
per well, whereas, the typical manual process took up to 5.3h per well. This
change reduced NPT from 5h/well to just 5min/well (on average) and
increased the time that engineers had to collaborate on more complex
issues from a few minutes to 60min. In this particular multitask workflow,
Fig. 5.19 A typical dashboard for a well test validation, which shows gas rate and CHP
versus time and choke size. Critical flow passes the check point if the value is >1.0, and
stability passes check point if it is >0.0 or is constant with time. Gas rate and CHP errors
are computed against the physical models.