
Page 241 - Intelligent Digital Oil And Gas Fields
P. 241
Workflow Automation and Intelligent Control 191
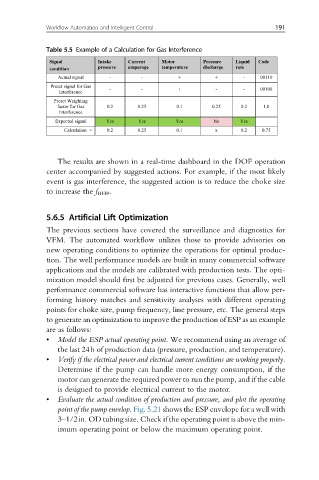
Table 5.5 Example of a Calculation for Gas Interference
The results are shown in a real-time dashboard in the DOF operation
center accompanied by suggested actions. For example, if the most likely
event is gas interference, the suggested action is to reduce the choke size
to increase the f BHP .
5.6.5 Artificial Lift Optimization
The previous sections have covered the surveillance and diagnostics for
VFM. The automated workflow utilizes those to provide advisories on
new operating conditions to optimize the operations for optimal produc-
tion. The well performance models are built in many commercial software
applications and the models are calibrated with production tests. The opti-
mization model should first be adjusted for previous cases. Generally, well
performance commercial software has interactive functions that allow per-
forming history matches and sensitivity analyses with different operating
points for choke size, pump frequency, line pressure, etc. The general steps
to generate an optimization to improve the production of ESP as an example
are as follows:
• Model the ESP actual operating point. We recommend using an average of
the last 24h of production data (pressure, production, and temperature).
• Verify if the electrical power and electrical current conditions are working properly.
Determine if the pump can handle more energy consumption, if the
motor can generate the required power to run the pump, and if the cable
is designed to provide electrical current to the motor.
• Evaluate the actual condition of production and pressure, and plot the operating
point of the pump envelop. Fig. 5.21 shows the ESP envelope for a well with
3–1/2in. OD tubing size. Check if the operating point is above the min-
imum operating point or below the maximum operating point.