
Page 242 - Intelligent Digital Oil And Gas Fields
P. 242
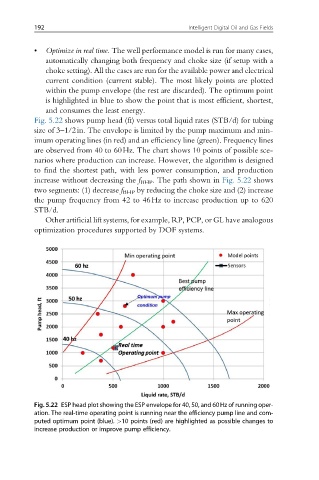
192                                       Intelligent Digital Oil and Gas Fields


          •  Optimize in real time. The well performance model is run for many cases,
             automatically changing both frequency and choke size (if setup with a
             choke setting). All the cases are run for the available power and electrical
             current condition (current stable). The most likely points are plotted
             within the pump envelope (the rest are discarded). The optimum point
             is highlighted in blue to show the point that is most efficient, shortest,
             and consumes the least energy.
          Fig. 5.22 shows pump head (ft) versus total liquid rates (STB/d) for tubing
          size of 3–1/2in. The envelope is limited by the pump maximum and min-
          imum operating lines (in red) and an efficiency line (green). Frequency lines
          are observed from 40 to 60Hz. The chart shows 10 points of possible sce-
          narios where production can increase. However, the algorithm is designed
          to find the shortest path, with less power consumption, and production
          increase without decreasing the f BHP . The path shown in Fig. 5.22 shows
          two segments: (1) decrease f BHP by reducing the choke size and (2) increase
          the pump frequency from 42 to 46Hz to increase production up to 620
          STB/d.
             Other artificial lift systems, for example, RP, PCP, or GL have analogous
          optimization procedures supported by DOF systems.


          Fig. 5.22 ESP head plot showing the ESP envelope for 40, 50, and 60Hz of running oper-
          ation. The real-time operating point is running near the efficiency pump line and com-
          puted optimum point (blue). >10 points (red) are highlighted as possible changes to
          increase production or improve pump efficiency.