
Page 240 - Intelligent Digital Oil And Gas Fields
P. 240
190 Intelligent Digital Oil and Gas Fields
• tubing leak,
• viscous fluids friction,
• electrical issue.
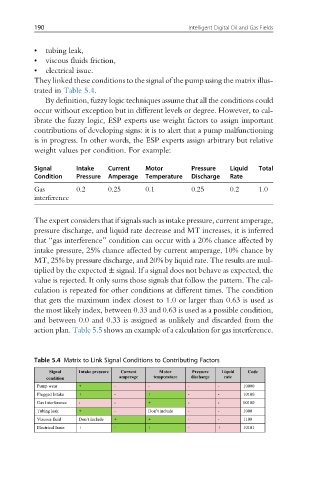
They linked these conditions to the signal of the pump using the matrix illus-
trated in Table 5.4.
By definition, fuzzy logic techniques assume that all the conditions could
occur without exception but in different levels or degree. However, to cal-
ibrate the fuzzy logic, ESP experts use weight factors to assign important
contributions of developing signs: it is to alert that a pump malfunctioning
is in progress. In other words, the ESP experts assign arbitrary but relative
weight values per condition. For example:
Signal Intake Current Motor Pressure Liquid Total
Condition Pressure Amperage Temperature Discharge Rate
Gas 0.2 0.25 0.1 0.25 0.2 1.0
interference
The expert considers that if signals such as intake pressure, current amperage,
pressure discharge, and liquid rate decrease and MT increases, it is inferred
that “gas interference” condition can occur with a 20% chance affected by
intake pressure, 25% chance affected by current amperage, 10% chance by
MT, 25% by pressure discharge, and 20% by liquid rate. The results are mul-
tiplied by the expected signal. If a signal does not behave as expected, the
value is rejected. It only sums those signals that follow the pattern. The cal-
culation is repeated for other conditions at different times. The condition
that gets the maximum index closest to 1.0 or larger than 0.63 is used as
the most likely index, between 0.33 and 0.63 is used as a possible condition,
and between 0.0 and 0.33 is assigned as unlikely and discarded from the
action plan. Table 5.5 shows an example of a calculation for gas interference.
Table 5.4 Matrix to Link Signal Conditions to Contributing Factors