
Page 157 - Intermediate Statistics for Dummies
P. 157
12_045206 ch07.qxd 2/1/07 9:54 AM Page 136
136
Part II: Making Predictions by Using Regression
10
8
Quiz score
6
4
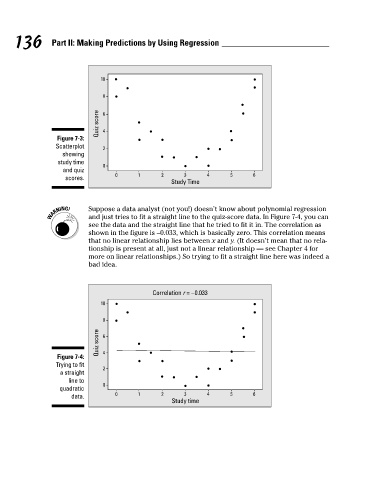
Figure 7-3:
Scatterplot
2
showing
study time
0
and quiz
5
0
6
1
4
2
3
scores.
Study Time
Suppose a data analyst (not you!) doesn’t know about polynomial regression
and just tries to fit a straight line to the quiz-score data. In Figure 7-4, you can
see the data and the straight line that he tried to fit it in. The correlation as
shown in the figure is –0.033, which is basically zero. This correlation means
that no linear relationship lies between x and y. (It doesn’t mean that no rela-
tionship is present at all, just not a linear relationship — see Chapter 4 for
more on linear relationships.) So trying to fit a straight line here was indeed a
bad idea.
Correlation r = −0.033
10
8
Quiz score 6
Figure 7-4: 4
Trying to fit
2
a straight
line to
0
quadratic
0 1 2 3 4 5 6
data.
Study time