
Page 158 - Intermediate Statistics for Dummies
P. 158
12_045206 ch07.qxd 2/1/07 9:54 AM Page 137
After you know that a quadratic polynomial seems to be a good fit for the
data, the next challenge is finding the equation for that particular parabola
that fits the data, among all the possible parabolas out there. Remember from
2
algebra that the general equation of a parabola is y = ax + bx + c. Now you
have to find the values of a, b, and c that create the best-fitting parabola to
the data (just like you find the a and the b that create the best-fitting line to
data in a linear regression model). That is the object of the regression model.
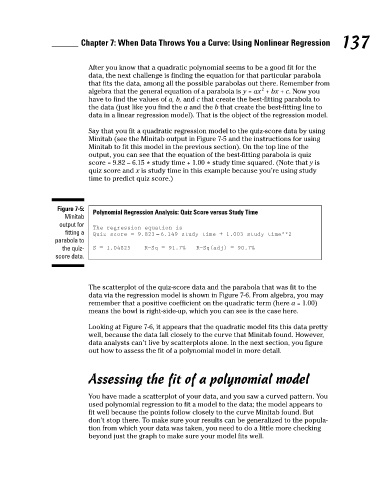
Say that you fit a quadratic regression model to the quiz-score data by using
Minitab (see the Minitab output in Figure 7-5 and the instructions for using
Minitab to fit this model in the previous section). On the top line of the
output, you can see that the equation of the best-fitting parabola is quiz
score = 9.82 – 6.15 study time + 1.00 study time squared. (Note that y is
*
*
quiz score and x is study time in this example because you’re using study
time to predict quiz score.)
Figure 7-5: Chapter 7: When Data Throws You a Curve: Using Nonlinear Regression 137
Polynomial Regression Analysis: Quiz Score versus Study Time
Minitab
output for
The regression equation is
fitting a Quiz score = 9.823 − 6.149 study time + 1.003 study time**2
parabola to
the quiz- S = 1.04825 R−Sq = 91.7% R−Sq(adj) = 90.7%
score data.
The scatterplot of the quiz-score data and the parabola that was fit to the
data via the regression model is shown in Figure 7-6. From algebra, you may
remember that a positive coefficient on the quadratic term (here a = 1.00)
means the bowl is right-side-up, which you can see is the case here.
Looking at Figure 7-6, it appears that the quadratic model fits this data pretty
well, because the data fall closely to the curve that Minitab found. However,
data analysts can’t live by scatterplots alone. In the next section, you figure
out how to assess the fit of a polynomial model in more detail.
Assessing the fit of a polynomial model
You have made a scatterplot of your data, and you saw a curved pattern. You
used polynomial regression to fit a model to the data; the model appears to
fit well because the points follow closely to the curve Minitab found. But
don’t stop there. To make sure your results can be generalized to the popula-
tion from which your data was taken, you need to do a little more checking
beyond just the graph to make sure your model fits well.