Page 159 - Intermediate Statistics for Dummies
P. 159

12_045206 ch07.qxd  2/1/07  9:54 AM  Page 138
                               138
                                         Part II: Making Predictions by Using Regression
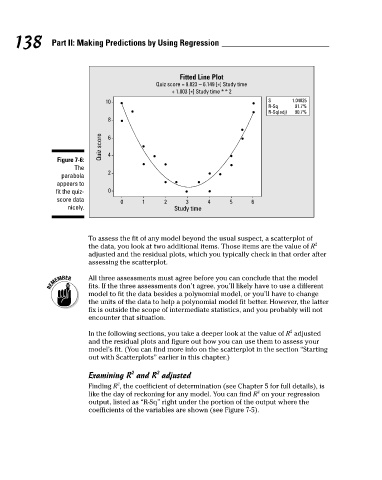
                                                                             Fitted Line Plot
                                                                                       *
                                                                           + 1.003 [  ] Study time * * 2
                                                                                *
                                                                                                             91.7%
                                                                                                      R-Sq(adj)
                                                                                                             90.7%
                                           Figure 7-6:
                                                The
                                            parabola
                                           appears to
                                           fit the quiz-
                                           score data
                                                                         2
                                                                               3
                                                                                     4
                                                                                           5
                                              nicely.  Quiz score  10 8 6 4 2 0  0  1  Quiz score = 9.823 − 6.149 [  ] Study time  6  S R-Sq  1.04825
                                                                           Study time
                                                    To assess the fit of any model beyond the usual suspect, a scatterplot of
                                                    the data, you look at two additional items. Those items are the value of R 2
                                                    adjusted and the residual plots, which you typically check in that order after
                                                    assessing the scatterplot.
                                                    All three assessments must agree before you can conclude that the model
                                                    fits. If the three assessments don’t agree, you’ll likely have to use a different
                                                    model to fit the data besides a polynomial model, or you’ll have to change
                                                    the units of the data to help a polynomial model fit better. However, the latter
                                                    fix is outside the scope of intermediate statistics, and you probably will not
                                                    encounter that situation.
                                                                                                            2
                                                    In the following sections, you take a deeper look at the value of R adjusted
                                                    and the residual plots and figure out how you can use them to assess your
                                                    model’s fit. (You can find more info on the scatterplot in the section “Starting
                                                    out with Scatterplots” earlier in this chapter.)
                                                                2
                                                                       2
                                                    Examining R and R adjusted
                                                            2
                                                    Finding R , the coefficient of determination (see Chapter 5 for full details), is
                                                                                                   2
                                                    like the day of reckoning for any model. You can find R on your regression
                                                    output, listed as “R-Sq” right under the portion of the output where the
                                                    coefficients of the variables are shown (see Figure 7-5).
   154   155   156   157   158   159   160   161   162   163   164