
Page 164 - Intermediate Statistics for Dummies
P. 164
12_045206 ch07.qxd 2/1/07 9:55 AM Page 143
Chapter 7: When Data Throws You a Curve: Using Nonlinear Regression
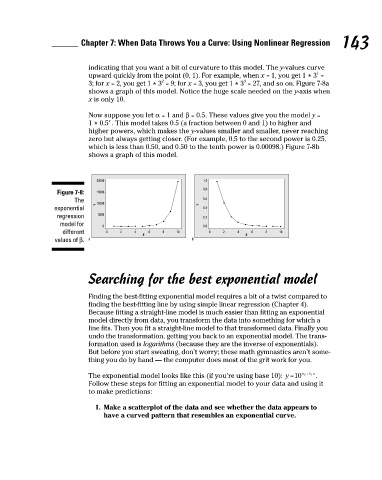
indicating that you want a bit of curvature to this model. The y-values curve
upward quickly from the point (0, 1). For example, when x = 1, you get 1 3 =
3; for x = 2, you get 1 3 = 9; for x = 3, you get 1 3 = 27, and so on. Figure 7-8a
shows a graph of this model. Notice the huge scale needed on the y-axis when
x is only 10.
Now suppose you let α = 1 and β = 0.5. These values give you the model y =
1 0.5 . This model takes 0.5 (a fraction between 0 and 1) to higher and
*
higher powers, which makes the y-values smaller and smaller, never reaching
zero but always getting closer. (For example, 0.5 to the second power is 0.25,
which is less than 0.50, and 0.50 to the tenth power is 0.00098.) Figure 7-8b
shows a graph of this model.
1.0
20000
0.8
Figure 7-8:
15000
The
Y 10000 x * 2 Y 0.6 * 3 * 1 143
exponential 0.4
regression 5000 0.2
model for 0 0.0
different 0 2 4 6 8 10 0 2 4 6 8 10
X X
values of β. a b
Searching for the best exponential model
Finding the best-fitting exponential model requires a bit of a twist compared to
finding the best-fitting line by using simple linear regression (Chapter 4).
Because fitting a straight-line model is much easier than fitting an exponential
model directly from data, you transform the data into something for which a
line fits. Then you fit a straight-line model to that transformed data. Finally you
undo the transformation, getting you back to an exponential model. The trans-
formation used is logarithms (because they are the inverse of exponentials).
But before you start sweating, don’t worry; these math gymnastics aren’t some-
thing you do by hand — the computer does most of the grit work for you.
The exponential model looks like this (if you’re using base 10): y 10= b 0 + b x .
1
Follow these steps for fitting an exponential model to your data and using it
to make predictions:
1. Make a scatterplot of the data and see whether the data appears to
have a curved pattern that resembles an exponential curve.