
Page 169 - Intermediate Statistics for Dummies
P. 169
12_045206 ch07.qxd 2/1/07 9:56 AM Page 148
148
Part II: Making Predictions by Using Regression
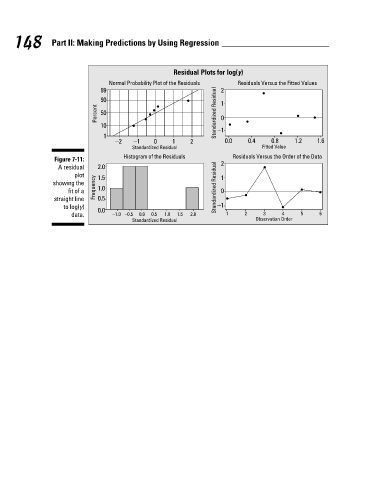
Residual Plots for log(y)
Residuals Versus the Fitted Values
99
90
50
10
0.4
0.8
1.6
1.2
−1
−2
0
2
1
Fitted Value
Standardized Residual
Histogram of the Residuals
Figure 7-11:
A residual
plot
1.5
showing the
1.0
fit of a
0.5
straight line
−1
to log(y) Frequency Percent 2.0 1 Normal Probability Plot of the Residuals Standardized Residual Standardized Residual −1 2 1 0 2 1 0 0.0 Residuals Versus the Order of the Data
0.0
data. −1.0 −0.5 0.0 0.5 1.0 1.5 2.0 1 2 3 4 5 6
Standardized Residual Observation Order