Page 172 - Intermediate Statistics for Dummies
P. 172

13_045206 ch08.qxd  2/1/07  9:57 AM  Page 151
                                            Chapter 8: Yes, No, Maybe So: Making Predictions by Using Logistic Regression
                                                    the logistic regression model
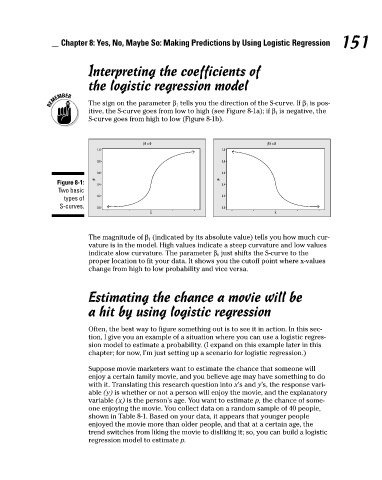
                                                    The sign on the parameter β 1 tells you the direction of the S-curve. If β 1 is pos-
                                                    itive, the S-curve goes from low to high (see Figure 8-1a); if β 1 is negative, the
                                                    S-curve goes from high to low (Figure 8-1b).
                                                                   β1 > 0
                                                                                         1.0
                                                      1.0
                                                      0.8
                                                                                         0.8
                                                      0.6
                                                                                         0.6
                                                     p
                                                                                        p
                                           Figure 8-1:
                                                      0.4
                                                                                         0.4
                                           Two basic
                                                      0.2
                                                                                         0.2
                                             types of
                                            S-curves.  Interpreting the coefficients of              β1 < 0               151
                                                                                         0.0
                                                      0.0
                                                                     X                                 X
                                                    The magnitude of β 1 (indicated by its absolute value) tells you how much cur-
                                                    vature is in the model. High values indicate a steep curvature and low values
                                                    indicate slow curvature. The parameter β 0 just shifts the S-curve to the
                                                    proper location to fit your data. It shows you the cutoff point where x-values
                                                    change from high to low probability and vice versa.
                                                    Estimating the chance a movie will be
                                                    a hit by using logistic regression
                                                    Often, the best way to figure something out is to see it in action. In this sec-
                                                    tion, I give you an example of a situation where you can use a logistic regres-
                                                    sion model to estimate a probability. (I expand on this example later in this
                                                    chapter; for now, I’m just setting up a scenario for logistic regression.)
                                                    Suppose movie marketers want to estimate the chance that someone will
                                                    enjoy a certain family movie, and you believe age may have something to do
                                                    with it. Translating this research question into x’s and y’s, the response vari-
                                                    able (y) is whether or not a person will enjoy the movie, and the explanatory
                                                    variable (x) is the person’s age. You want to estimate p, the chance of some-
                                                    one enjoying the movie. You collect data on a random sample of 40 people,
                                                    shown in Table 8-1. Based on your data, it appears that younger people
                                                    enjoyed the movie more than older people, and that at a certain age, the
                                                    trend switches from liking the movie to disliking it; so, you can build a logistic
                                                    regression model to estimate p.
   167   168   169   170   171   172   173   174   175   176   177