Page 175 - Intermediate Statistics for Dummies
P. 175

13_045206 ch08.qxd  2/1/07  10:00 AM  Page 154
                               154
                                         Part II: Making Predictions by Using Regression
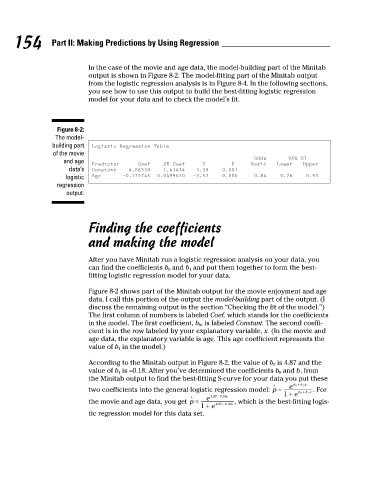
                                                    In the case of the movie and age data, the model-building part of the Minitab
                                                    output is shown in Figure 8-2. The model-fitting part of the Minitab output
                                                    from the logistic regression analysis is in Figure 8-4. In the following sections,
                                                    you see how to use this output to build the best-fitting logistic regression
                                                    model for your data and to check the model’s fit.
                                           Figure 8-2:
                                          The model-
                                          building part
                                                    Logistic Regression Table
                                          of the movie
                                                                                                  Odds       95% CI
                                             and age
                                                                 Coef
                                                                                   Z
                                                                                           P
                                                                        SE Coef
                                                    Predictor
                                              data’s
                                                                                  3.39
                                                                        1.43434
                                                    Constant
                                                               4.86539
                                                                                                                0.93
                                                                                                         0.76
                                                                                         0.000
                                                                                                  0.84
                                                                       0.0499620
                                                                                 –3.52
                                                             –0.175745
                                                    Age
                                             logistic
                                           regression
                                             output.
                                                    Finding the coefficients             0.001   Ratio   Lower   Upper
                                                    and making the model
                                                    After you have Minitab run a logistic regression analysis on your data, you
                                                    can find the coefficients b 0 and b 1 and put them together to form the best-
                                                    fitting logistic regression model for your data.
                                                    Figure 8-2 shows part of the Minitab output for the movie enjoyment and age
                                                    data. I call this portion of the output the model-building part of the output. (I
                                                    discuss the remaining output in the section “Checking the fit of the model.”)
                                                    The first column of numbers is labeled Coef, which stands for the coefficients
                                                    in the model. The first coefficient, b 0, is labeled Constant. The second coeffi-
                                                    cient is in the row labeled by your explanatory variable, x. (In the movie and
                                                    age data, the explanatory variable is age. This age coefficient represents the
                                                    value of b 1 in the model.)
                                                    According to the Minitab output in Figure 8-2, the value of b 0 is 4.87 and the
                                                    value of b 1 is –0.18. After you’ve determined the coefficients b 0 and b 1 from
                                                    the Minitab output to find the best-fitting S-curve for your data you put these
                                                                                                       /   e  b 0 +  b x
                                                                                                               1
                                                    two coefficients into the general logistic regression model: p =  b 0 + b x . For
                                                                                                                1
                                                                                         1
                                                                                         8
                                                                                /   e  . 487 -  0 . x     1 +  e
                                                    the movie and age data, you get p =   . x , which is the best-fitting logis-
                                                                                   1 +  e  . 487 -  01 8
                                                    tic regression model for this data set.
   170   171   172   173   174   175   176   177   178   179   180