Page 179 - Intermediate Statistics for Dummies
P. 179

13_045206 ch08.qxd  2/1/07  10:02 AM  Page 158
                               158
                                         Part II: Making Predictions by Using Regression
                                                    predictions as to whether the event should have occurred for each individual
                                                    based on the model and compare those results to what actually happened.
                                                    Now the logistic regression model is for p, the probability of the event occur-
                                                    ring, so if p is estimated to be > 0.50 for some value of x, your best guess is
                                                    that the event will occur (versus not occurring). If the estimated value of p is
                                                    < 0.50 for a particular x-value, your best guess is that it won’t occur.
                                                    For the movie and age data, the percentage of concordant pairs (that is, the
                                                    percentage of times the model made the right decision in predicting what
                                                    would happen) is 87.3 percent, which is quite high. The percentage of concor-
                                                    dant pairs was obtained by taking the number of concordant pairs and divid-
                                                    ing by the total number of pairs. I’d start getting excited if the percentage of
                                                    concordant pairs got over 75 percent; the higher, the better.
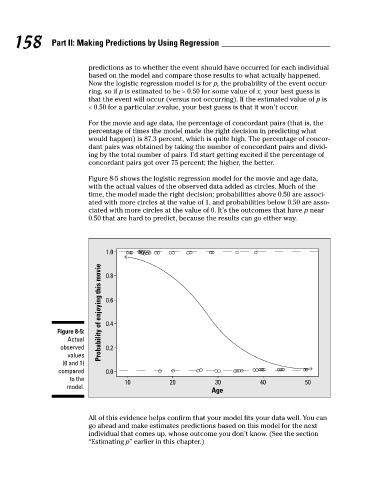
                                                    Figure 8-5 shows the logistic regression model for the movie and age data,
                                                    with the actual values of the observed data added as circles. Much of the
                                                    time, the model made the right decision; probabilities above 0.50 are associ-
                                                    ated with more circles at the value of 1, and probabilities below 0.50 are asso-
                                                    ciated with more circles at the value of 0. It’s the outcomes that have p near
                                                    0.50 that are hard to predict, because the results can go either way.
                                                        1.0
                                                       Probability of enjoying this movie  0.6
                                                        0.8
                                           Figure 8-5:  0.4
                                              Actual
                                            observed    0.2
                                              values
                                            (0 and 1)
                                           compared     0.0
                                              to the          10          20           30          40           50
                                              model.
                                                                                      Age


                                                    All of this evidence helps confirm that your model fits your data well. You can
                                                    go ahead and make estimates predictions based on this model for the next
                                                    individual that comes up, whose outcome you don’t know. (See the section
                                                    “Estimating p” earlier in this chapter.)
   174   175   176   177   178   179   180   181   182   183   184