
Page 158 - Intro Predictive Maintenance
P. 158
Vibration Monitoring and Analysis 149
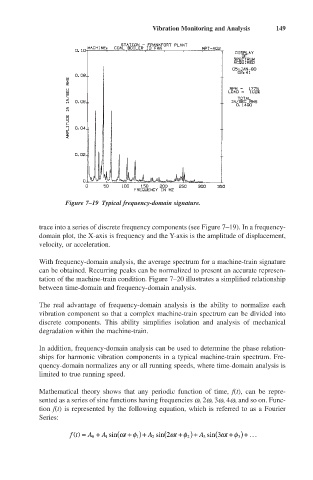
Figure 7–19 Typical frequency-domain signature.
trace into a series of discrete frequency components (see Figure 7–19). In a frequency-
domain plot, the X-axis is frequency and the Y-axis is the amplitude of displacement,
velocity, or acceleration.
With frequency-domain analysis, the average spectrum for a machine-train signature
can be obtained. Recurring peaks can be normalized to present an accurate represen-
tation of the machine-train condition. Figure 7–20 illustrates a simplified relationship
between time-domain and frequency-domain analysis.
The real advantage of frequency-domain analysis is the ability to normalize each
vibration component so that a complex machine-train spectrum can be divided into
discrete components. This ability simplifies isolation and analysis of mechanical
degradation within the machine-train.
In addition, frequency-domain analysis can be used to determine the phase relation-
ships for harmonic vibration components in a typical machine-train spectrum. Fre-
quency-domain normalizes any or all running speeds, where time-domain analysis is
limited to true running speed.
Mathematical theory shows that any periodic function of time, f(t), can be repre-
sented as a series of sine functions having frequencies w, 2w, 3w, 4w, and so on. Func-
tion f(t) is represented by the following equation, which is referred to as a Fourier
Series:
f
f
ft () = A + A 1 sin (w t + )+ A 2 sin (2w t + )+ A 3 sin (3w t + )+ ...
f
3
2
1
0