
Page 122 - Introduction to Autonomous Mobile Robots
P. 122
Perception
measurement cone 107
0°
-30° 30°
-60° 60°
Amplitude [dB]
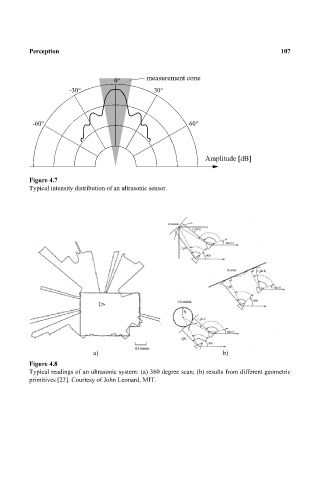
Figure 4.7
Typical intensity distribution of an ultrasonic sensor.
a) b)
Figure 4.8
Typical readings of an ultrasonic system: (a) 360 degree scan; (b) results from different geometric
primitives [23]. Courtesy of John Leonard, MIT.