Page 257 - Introduction to Autonomous Mobile Robots
P. 257

242

                                       ∂ α ti  ∂ α ti  ∂ α ti                             Chapter 5
                                         ,
                                              ,
                                                  ,
                                       ----------- ----------- -----------
                                ∇ h =    x ˆ ∂  y ˆ ∂  ∂ θ ˆ  =  0  0    – 1                 (5.65)
                                  i
                                        r ∂  r ∂  r ∂   – cos W α  – sin W α  0
                                              ,
                                         ,
                                                  ,
                                                                       ,
                                                               ,
                                         ti
                                                  ti
                                             ti
                                       --------- --------- ---------  ti  ti
                                         x ˆ ∂  y ˆ ∂  ∂ θ ˆ
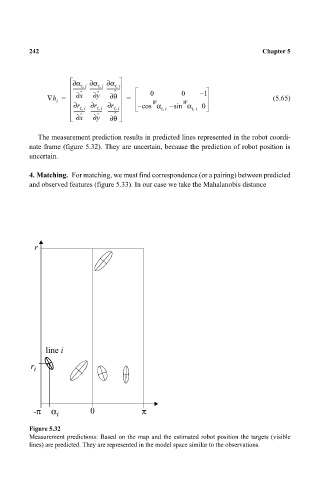
                             The measurement prediction results in predicted lines represented in the robot coordi-
                           nate frame (figure 5.32). They are uncertain, because the prediction of robot position is
                           uncertain.
                           4. Matching. For matching, we must find correspondence (or a pairing) between predicted
                           and observed features (figure 5.33). In our case we take the Mahalanobis distance


                            r


                               line i
                           r i


                            -π   α i       0             π


                           Figure 5.32
                           Measurement predictions: Based on the map and the estimated robot position the targets (visible
                           lines) are predicted. They are represented in the model space similar to the observations.
   252   253   254   255   256   257   258   259   260   261   262