
Page 129 - Introduction to Colloid and Surface Chemistry
P. 129
The solid-gas interface 119
physical adsorption and chemisorption curves, and varies widely from
system to system; for example, it is low for the chemisorption of
hydrogen on to most metal surfaces.
If the activation energy for chemisorption is appreciable, the rate
of chemisorption at low temperature may be so slow that, in practice,
only physical adsorption is observed.
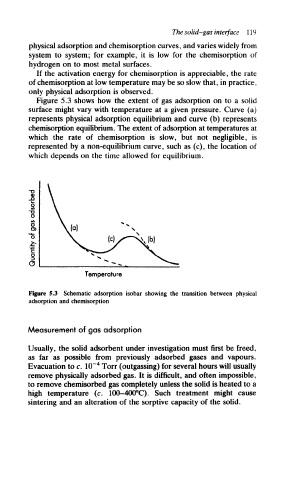
Figure 5.3 shows how the extent of gas adsorption on to a solid
surface might vary with temperature at a given pressure. Curve (a)
represents physical adsorption equilibrium and curve (b) represents
chemisorption equilibrium. The extent of adsorption at temperatures at
which the rate of chemisorption is slow, but not negligible, is
represented by a non-equilibrium curve, such as (c), the location of
which depends on the time allowed for equilibrium.
J8
TJ
O
(b)
O
0
Temperature
Figure 5.3 Schematic adsorption isobar showing the transition between physical
adsorption and chemisorption
Measurement of gas adsorption
Usually, the solid adsorbent under investigation must first be freed,
as far as possible from previously adsorbed gases and vapours.
4
Evacuation to c. 10~ Torr (outgassing) for several hours will usually
remove physically adsorbed gas. It is difficult, and often impossible,
to remove chemisorbed gas completely unless the solid is heated to a
high temperature (c. 100-400°C). Such treatment might cause
sintering and an alteration of the sorptive capacity of the solid.