
Page 210 - Introduction to Information Optics
P. 210
3.4. Fiber-Optic Networks
A,,, A,, A. 3
(a) (b)
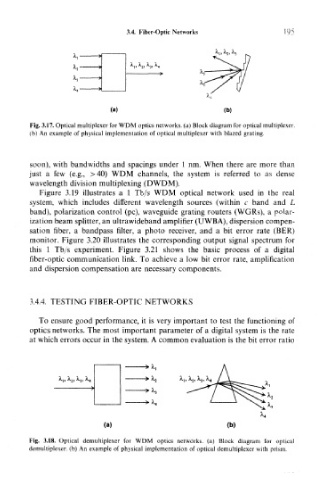
Fig. 3.17. Optical multiplexer for WDM optics networks, (a) Block diagram for optical multiplexer,
(b) An example of physical implementation of optical multiplexer with blazed grating.
soon), with band widths and spacings under 1 nm. When there are more than
just a few (e.g., >40) WDM channels, the system is referred to as dense
wavelength division multiplexing (DWDM).
Figure 3.19 illustrates a 1 Tb/s WDM optical network used in the real
system, which includes different wavelength sources (within c band and L
band), polarization control (pc), waveguide grating routers (WGRs), a polar-
ization beam splitter, an ultra wideband amplifier (UWBA), dispersion compen-
sation fiber, a bandpass filter, a photo receiver, and a bit error rate (BER)
monitor. Figure 3.20 illustrates the corresponding output signal spectrum for
this 1 Tb/s experiment. Figure 3.21 shows the basic process of a digital
fiber-optic communication link. To achieve a low bit error rate, amplification
and dispersion compensation are necessary components.
3.4.4. TESTING FIBER-OPTIC NETWORKS
To ensure good performance, it is very important to test the functioning of
optics networks. The most important parameter of a digital system is the rate
at which errors occur in the system. A common evaluation is the bit error ratio
(a)
Fig. 3.18. Optical demultiplexer for WDM optics networks, (a) Block diagram for optical
demultiplexer, (b) An example of physical implementation of optical demultiplexer with prism.