Page 379 - Introduction to Information Optics
P. 379
364                  7. Pattern Recognition with Optics

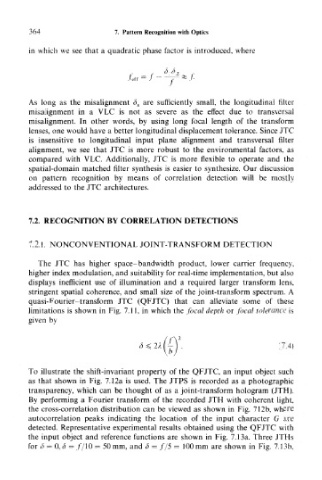
        in which we see that a quadratic phase factor is introduced, where


        As long as the misalignment <5 S are sufficiently small, the longitudinal filter
        misalignment in a VLC is not as severe as the effect due to transversal
        misalignment. In other words, by using long focal length of the transform
        lenses, one would have a better longitudinal displacement tolerance. Since JTC
        is insensitive to longitudinal input plane alignment and transversal filter
        alignment, we see that JTC is more robust to the environmental factors, as
        compared with VLC. Additionally, JTC is more flexible to operate and the
        spatial-domain matched filter synthesis is easier to synthesize. Our discussion
        on pattern recognition by means of correlation detection will be mostly
        addressed to the JTC architectures.


        7.2. RECOGNITION BY CORRELATION DETECTIONS

        7.2.1. NONCONVENTIONAL JOINT-TRANSFORM DETECTION


          The JTC has higher space-bandwidth product, lower carrier frequency,
        higher index modulation, and suitability for real-time implementation, but also
        displays inefficient use of illumination and a required larger transform lens,
        stringent spatial coherence, and small size of the joint-transform spectrum. A
        quasi-Fourier-transform JTC (QFJTC) that can alleviate some of these
        limitations is shown in Fig. 7.11, in which the focal depth or focal tolerance is
        given by


                                                                       (7.4)

       To illustrate the shift-invariant property of the QFJTC, an input object such
        as that shown in Fig. 7.12a is used. The JTPS is recorded as a photographic
        transparency, which can be thought of as a joint-transform hologram (JTH).
        By performing a Fourier transform of the recorded JTH with coherent light,
        the cross-correlation distribution can be viewed as shown in Fig. 712b, where
       autocorrelation peaks indicating the location of the input character G are
       detected. Representative experimental results obtained using the QFJTC with
       the input object and reference functions are shown in Fig. 7.13a. Three JTHs
        for  <5 = 0, 3 = //10 = 50mm, and (5 = f/5 = 100mm are shown in Fig. 7.13b,

