
Page 385 - Introduction to Information Optics
P. 385
370 7. Pattern Recognition with Optics
comparison, the output light distribution as obtained from the conventional
JTC (CJTC) is provided in Fig. 7.17c. We see that the correlation peaks have
been overwhelmed by the zero-order diffraction.
In summary, besides the removal of the zero-order diffraction, there are
other benefits of using NOJTC; for example, high diffraction efficiency and
better utilization of SLM pixel elements. Despite these benefits, there is a small
price to pay; NOJTC requires additional steps to capture and store the
zero-order power spectra.
7.2.3. POSITION-ENCODING JOINT-TRANSFORM DETECTION
The JTC can perform the convolution of two functions without using a
Fourier-domain filter, and it can also be used as a general optical processor.
Even though the JTC usually has a lower detection efficiency, the architecture
has certain merits. For instance, it does not have the stringent filter alignment
problem as does VLC. It is suitable for real-time implementation and more
robust to environment perturbation. To realize a spatial-domain filter in a
JTC, complex function implementation is often needed. It is, however, possible
to obtain complex-valued reference functions with an amplitude-modulated
SLM.
f
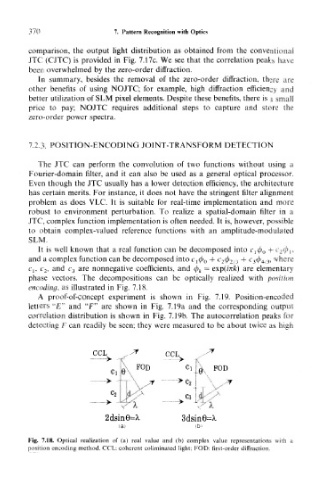
It is well known that a real function can be decomposed into c^, + c 2 l>i,
and a complex function can be decomposed into tj</> 0 + t' 20 2/3 + r 3<^ 4/3, where
t-j, c 2, and c 3 are nonnegative coefficients, and <p k = exp(m/c) are elementary
phase vectors. The decompositions can be optically realized with position
encoding, as illustrated in Fig. 7.18.
A proof-of-concept experiment is shown in Fig. 7.19. Position-encoded
U
letters £T and "F" are shown in Fig. 7.19a and the corresponding output
correlation distribution is shown in Fig. 7.19b. The autocorrelation peaks for
detecting F can readily be seen; they were measured to be about twice as high
CCL
Cl X FOB
\
\ /T
>C 2
• r '^
-,.
C3 OK>
-> J^
3dsin0=X
Fig. 7.18. Optical realization of (a) real value and (b) complex value representations with a
position encoding method. CCL: coherent coliminated light; FOD: first-order diffraction.