
Page 207 - Introduction to Mineral Exploration
P. 207
190 C.J. MOON & M.K.G. WHATELEY
55,000
50,000
45,000
250,000 255,000 260,000 265,000 270,000 275,000 280,000
Legend 10
km
Prospect
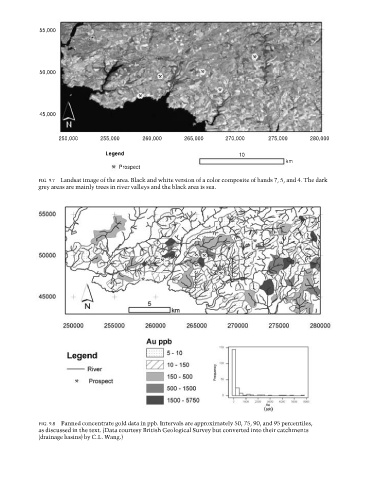
FIG. 9.7 Landsat image of the area. Black and white version of a color composite of bands 7, 5, and 4. The dark
grey areas are mainly trees in river valleys and the black area is sea.
FIG. 9.8 Panned concentrate gold data in ppb. Intervals are approximately 50, 75, 90, and 95 percentiles,
as discussed in the text. (Data courtesy British Geological Survey but converted into their catchments
(drainage basins) by C.L. Wang.)