
Page 144 - Introduction to Paleobiology and The Fossil Record
P. 144
MACROEVOLUTION AND THE TREE OF LIFE 131
parison with the outgroup of monkeys shows that monkeys, chimpanzees and gorillas have non-
opposable thumbs. So this is coded “0”, and the opposable thumb of humans appears to be unique,
an apomorphy, and so is coded “1”.
The final step is the tree calculation. All the characters and their codings are listed in a data
matrix, a tabulation of the data, listing all the species and all the characters and their codings. The
tree calculation is usually run by computer, and a search is carried out, using different methods, to
find the single tree, or group of trees, that best explain the data.
We give a simple worked example here, to determine the relationships of six vertebrates:
shark, salmon, frog, lizard, chicken and mouse. These are distant relatives, of course, representing
cartilaginous fi shes, bony fi shes, amphibians, reptiles, birds and mammals, respectively, but if we
can sort out their relationships, we have a broad outline of the phylogenetic tree of all
vertebrates.
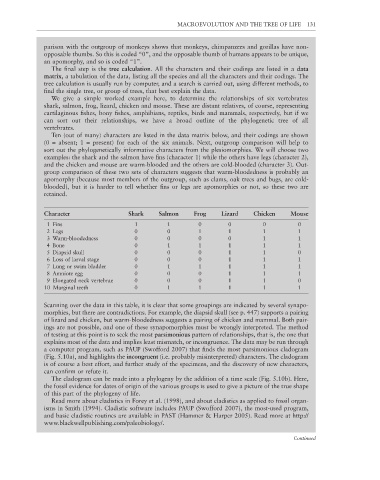
Ten (out of many) characters are listed in the data matrix below, and their codings are shown
(0 = absent; 1 = present) for each of the six animals. Next, outgroup comparison will help to
sort out the phylogenetically informative characters from the plesiomorphies. We will choose two
examples: the shark and the salmon have fins (character 1) while the others have legs (character 2),
and the chicken and mouse are warm-blooded and the others are cold-blooded (character 3). Out-
group comparison of these two sets of characters suggests that warm-bloodedness is probably an
apomorphy (because most members of the outgroup, such as clams, oak trees and bugs, are cold-
blooded), but it is harder to tell whether fins or legs are apomorphies or not, so these two are
retained.
Character Shark Salmon Frog Lizard Chicken Mouse
1 Fins 1 1 0 0 0 0
2 Legs 0 0 1 1 1 1
3 Warm-bloodedness 0 0 0 0 1 1
4 Bone 0 1 1 1 1 1
5 Diapsid skull 0 0 0 1 1 0
6 Loss of larval stage 0 0 0 1 1 1
7 Lung or swim bladder 0 1 1 1 1 1
8 Amniote egg 0 0 0 1 1 1
9 Elongated neck vertebrae 0 0 0 1 1 0
10 Marginal teeth 0 1 1 1 1 1
Scanning over the data in this table, it is clear that some groupings are indicated by several synapo-
morphies, but there are contradictions. For example, the diapsid skull (see p. 447) supports a pairing
of lizard and chicken, but warm-bloodedness suggests a pairing of chicken and mammal. Both pair-
ings are not possible, and one of these synapomorphies must be wrongly interpreted. The method
of testing at this point is to seek the most parsimonious pattern of relationships, that is, the one that
explains most of the data and implies least mismatch, or incongruence. The data may be run through
a computer program, such as PAUP (Swofford 2007) that finds the most parsimonious cladogram
(Fig. 5.10a), and highlights the incongruent (i.e. probably misinterpreted) characters. The cladogram
is of course a best effort, and further study of the specimens, and the discovery of new characters,
can confirm or refute it.
The cladogram can be made into a phylogeny by the addition of a time scale (Fig. 5.10b). Here,
the fossil evidence for dates of origin of the various groups is used to give a picture of the true shape
of this part of the phylogeny of life.
Read more about cladistics in Forey et al. (1998), and about cladistics as applied to fossil organ-
isms in Smith (1994). Cladistic software includes PAUP (Swofford 2007), the most-used program,
and basic cladistic routines are available in PAST (Hammer & Harper 2005). Read more at http://
www.blackwellpublishing.com/paleobiology/.
Continued