
Page 268 - Introduction to Petroleum Engineering
P. 268
PROBABILISTIC DCA 255
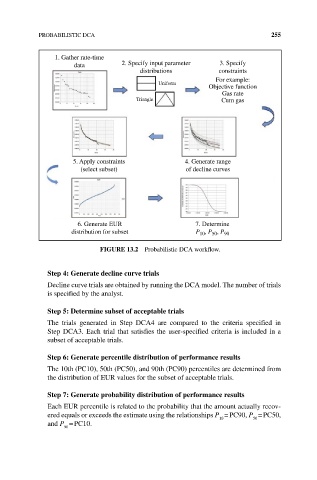
1. Gather rate-time
data 2. Specify input parameter 3. Specify
distributions constraints
For example:
Uniform
Objective function
Gas rate
Triangle Cum gas
5. Apply constraints 4. Generate range
(select subset) of decline curves
6. Generate EUR 7. Determine
distribution for subset P , P , P 90
50
10
FIgURE 13.2 Probabilistic DCA workflow.
Step 4: generate decline curve trials
Decline curve trials are obtained by running the DCA model. The number of trials
is specified by the analyst.
Step 5: Determine subset of acceptable trials
The trials generated in Step DCA4 are compared to the criteria specified in
Step DCA3. Each trial that satisfies the user‐specified criteria is included in a
subset of acceptable trials.
Step 6: generate percentile distribution of performance results
The 10th (PC10), 50th (PC50), and 90th (PC90) percentiles are determined from
the distribution of EUR values for the subset of acceptable trials.
Step 7: generate probability distribution of performance results
Each EUR percentile is related to the probability that the amount actually recov-
ered equals or exceeds the estimate using the relationships P = PC90, P = PC50,
10
50
and P = PC10.
90