
Page 89 - Introduction to Transfer Phenomena in PEM Fuel Cells
P. 89
78 Introduction to Transfer Phenomena in PEM Fuel Cells
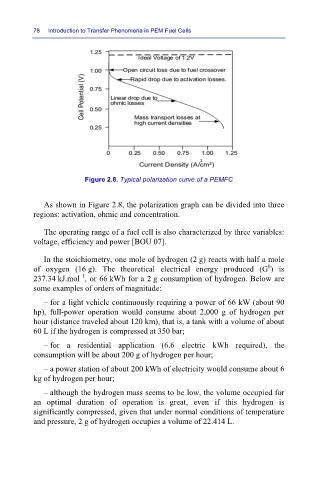
Figure 2.8. Typical polarization curve of a PEMFC
As shown in Figure 2.8, the polarization graph can be divided into three
regions: activation, ohmic and concentration.
The operating range of a fuel cell is also characterized by three variables:
voltage, efficiency and power [BOU 07].
In the stoichiometry, one mole of hydrogen (2 g) reacts with half a mole
0
of oxygen (16 g). The theoretical electrical energy produced (G ) is
–1
237.34 kJ.mol , or 66 kWh for a 2 g consumption of hydrogen. Below are
some examples of orders of magnitude:
– for a light vehicle continuously requiring a power of 66 kW (about 90
hp), full-power operation would consume about 2,000 g of hydrogen per
hour (distance traveled about 120 km), that is, a tank with a volume of about
60 L if the hydrogen is compressed at 350 bar;
– for a residential application (6.6 electric kWh required), the
consumption will be about 200 g of hydrogen per hour;
– a power station of about 200 kWh of electricity would consume about 6
kg of hydrogen per hour;
– although the hydrogen mass seems to be low, the volume occupied for
an optimal duration of operation is great, even if this hydrogen is
significantly compressed, given that under normal conditions of temperature
and pressure, 2 g of hydrogen occupies a volume of 22.414 L.