
Page 375 -
P. 375
358 Chapter 10
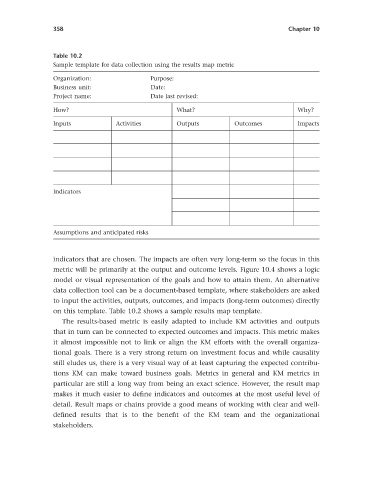
Table 10.2
Sample template for data collection using the results map metric
Organization: Purpose:
Business unit: Date:
Project name: Date last revised:
How? What? Why?
Inputs Activities Outputs Outcomes Impacts
Indicators
Assumptions and anticipated risks
indicators that are chosen. The impacts are often very long-term so the focus in this
metric will be primarily at the output and outcome levels. Figure 10.4 shows a logic
model or visual representation of the goals and how to attain them. An alternative
data collection tool can be a document-based template, where stakeholders are asked
to input the activities, outputs, outcomes, and impacts (long-term outcomes) directly
on this template. Table 10.2 shows a sample results map template.
The results-based metric is easily adapted to include KM activities and outputs
that in turn can be connected to expected outcomes and impacts. This metric makes
it almost impossible not to link or align the KM efforts with the overall organiza-
tional goals. There is a very strong return on investment focus and while causality
still eludes us, there is a very visual way of at least capturing the expected contribu-
tions KM can make toward business goals. Metrics in general and KM metrics in
particular are still a long way from being an exact science. However, the result map
makes it much easier to defi ne indicators and outcomes at the most useful level of
detail. Result maps or chains provide a good means of working with clear and well-
defi ned results that is to the benefi t of the KM team and the organizational
stakeholders.