
Page 258 - Laboratory Manual in Physical Geology
P. 258
(east)—see FIGURE 9.2. A quadrangle map is the map of a Lancaster 15’ Quadrangle) in the upper right and lower
quadrangle. right corners of the map, respectively. Also notice that the
Quadrangle maps are published in many different map has colors, patterns, and symbols ( FIGURE 9.4 ) that are
sizes but the most common USGS sizes are 15-minute and used to depict water bodies, vegetation, roads, buildings,
7.5-minute quadrangle maps ( FIGURE 9.2 ). The numbers political boundaries, place names, and other natural and
refer to the amount of area that the maps depict, in degrees cultural features of the landscape. The lower right corner
of latitude and longitude. A 15-minute topographic map of the map indicates that the map was originally published
represents an area that measures 15 minutes of latitude by in 1958, but it was photorevised in 1974. Photorevised
15 minutes of longitude. A 7.5-minute topographic map means that aerial photographs (from airplanes) were used
represents an area that measures 7.5 minutes of latitude to discover changes on the landscape, and the changes are
by 7.5 minutes of longitude. Therefore, four 7.5-minute overprinted on the maps in a standout color like purple,
quadrangle maps ( FIGURE 9.2 ) comprise one 15-minute red, or gray. The main new features shown on this 1974
quadrangle map. photorevised map are the California Aqueduct (that carries
A reduced copy of a 7.5 -minute USGS topographic water south, from the Sierra Nevada Mountains to the
map is provided in FIGURE 9.3 . Notice its name ( Ritter southern California desert) and several major highways.
Ridge, CA) and size (7.5 Minute Series, SW 1/4 of the
Map Scales
Maps are representations of an area of Earth’s surface. The real
20° north sizes of everything on a map have been reduced so they fit a
latitude sheet of paper or computer screen. So maps are scale models.
120° west
longitude N To understand how the real world is depicted by the map, you
Longitude 90° Latitude must refer to the map scales. Topographic maps commonly
line, or line, or
meridian 80° parallel have any or all of the following kinds of scales.
60°
Bar Scales for Measuring Distances on
40°
the Map
The most obvious scales on topographic maps are the
Equator A 20° bar scales (graphic scales) printed in their lower margins
( FIGURE 9.3 ). Bar scales are rulers for measuring distances
on the map. U.S. Geological Survey topographic maps
W 0° E
140° 120° 100° 80° 60° 40° 20° 0° 20° 40° 60° generally have four different bar scales: miles, feet,
kilometers, and meters.
20°
Scales That Tell How the Map Compares to
B 40° Actual Sizes of Objects
Ratio scales are commonly expressed above the bar scales
60° in the bottom margins of topographic maps and express
80° the ratio of a linear dimension on the map to the actual
Quadrangle Prime
90° meridian (0° E-W) dimension of the same feature on the ground (in real life).
S
For example, the ratio scale of the map in FIGURE 9.3 is
written as “SCALE 1:24,000.” This indicates that any
unit (inch, centimeter, foot, etc.) on the map is actually
15´ 24,000 of the same units (inches, centimeters, feet) on
the ground. So 1 cm on the map represents 24,000 cm on
the ground, or your thumb width on the map represents
24,000 thumb widths on the ground. The ratio scale can
also be interpreted as a fractional scale , which indicates
1
7 /2´
15´ how much smaller something is than its actual size on the
ground. A map ratio scale of 1:24,000 equals a fractional
scale of 1/24,000. This means that everything on the map
1
7 /2´ th
is 1/24,000 of its actual size on the ground.
Verbal Scales Express Map Proportions in
1
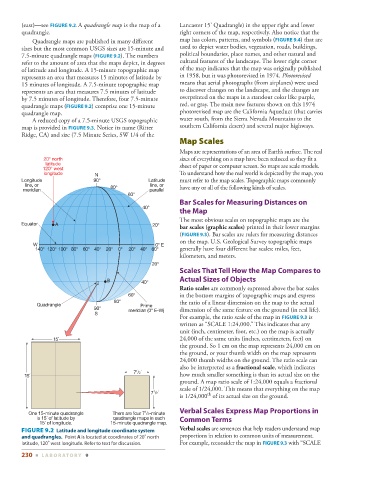
One 15-minute quadrangle There are four 7 /2-minute
is 15´ of latitude by quadrangle maps in each Common Terms
15´ of longitude. 15-minute quadrangle map.
Verbal scales are sentences that help readers understand map
FIGURE 9.2 Latitude and longitude coordinate system
and quadrangles. Point A is located at coordinates of 20° north proportions in relation to common units of measurement.
latitude, 120° west longitude. Refer to text for discussion. For example, reconsider the map in FIGURE 9.3 with “SCALE
230 ■ L ABOR ATORY 9